BCG GAMMA CO2.AI
Helping enterprises measure and reduce carbon emissions
Client
End Client

Location
Footprint Explorer
Working alongside BCG's research team, I led the architecture review for the Footprint Explorer — refining navigation, data interaction, and collaboration features through client workshops and card sorting.
The goal was aligning the tool with user needs while meeting environmental compliance objectives.
Initial Research
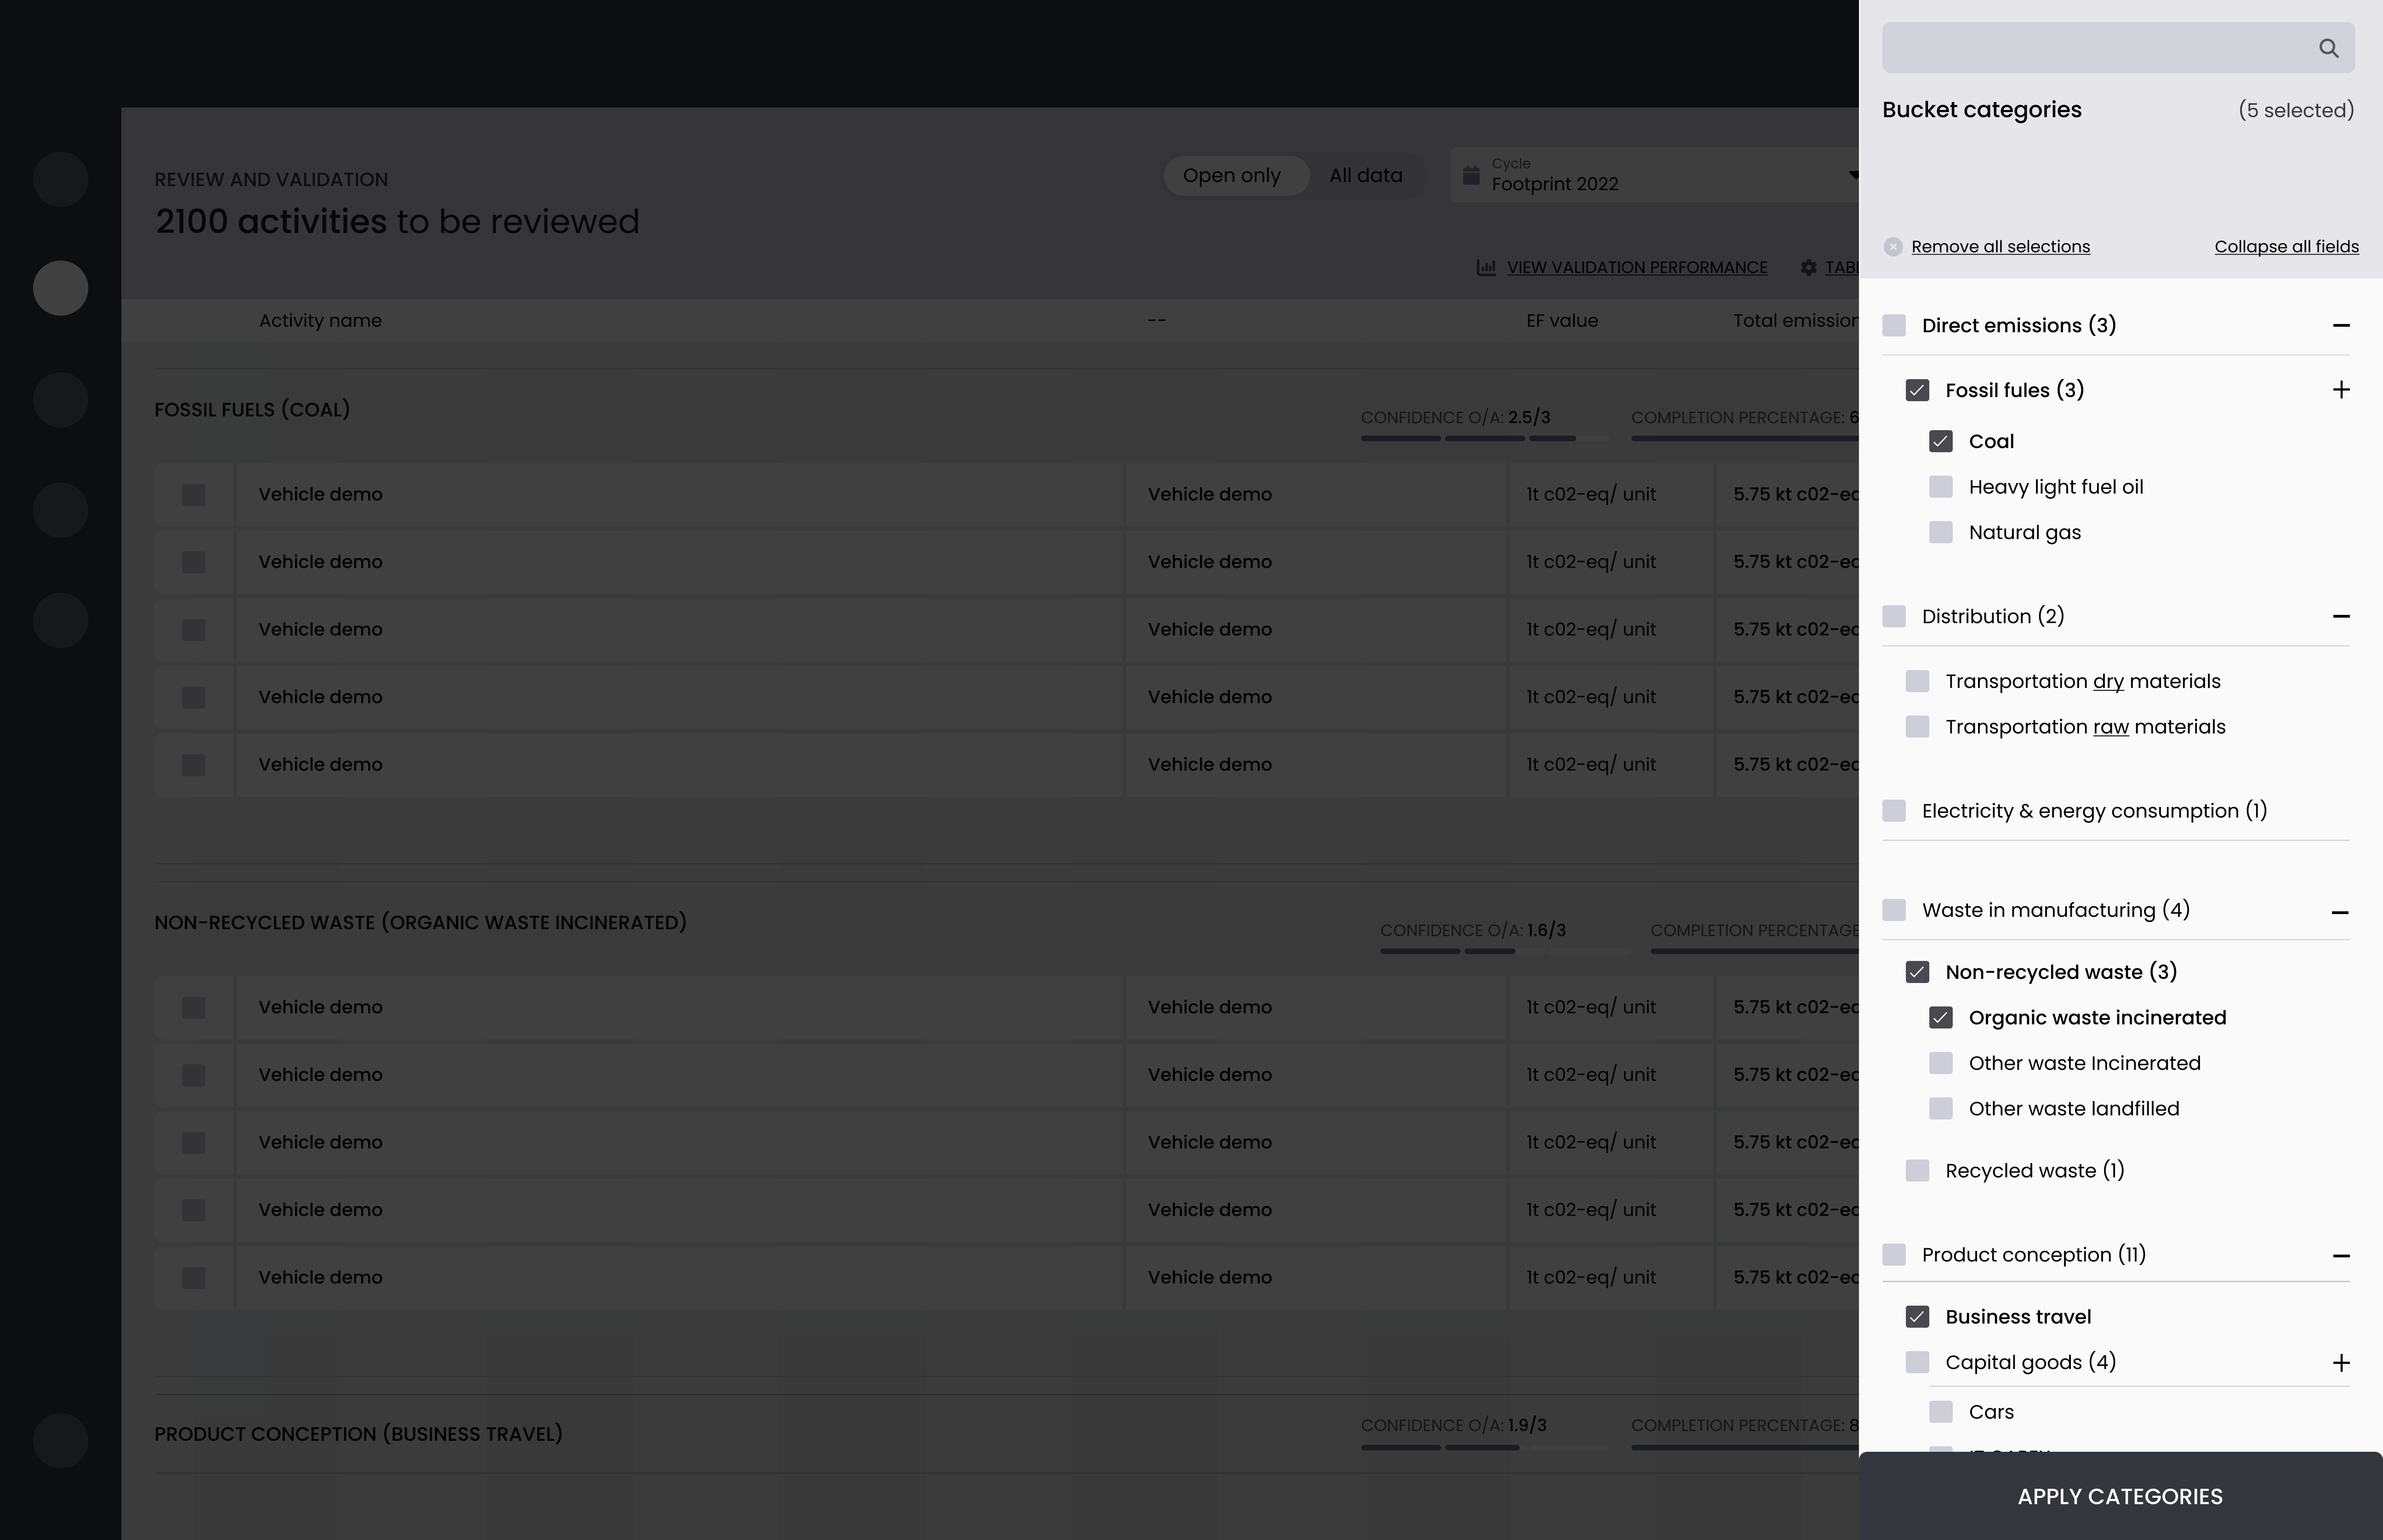
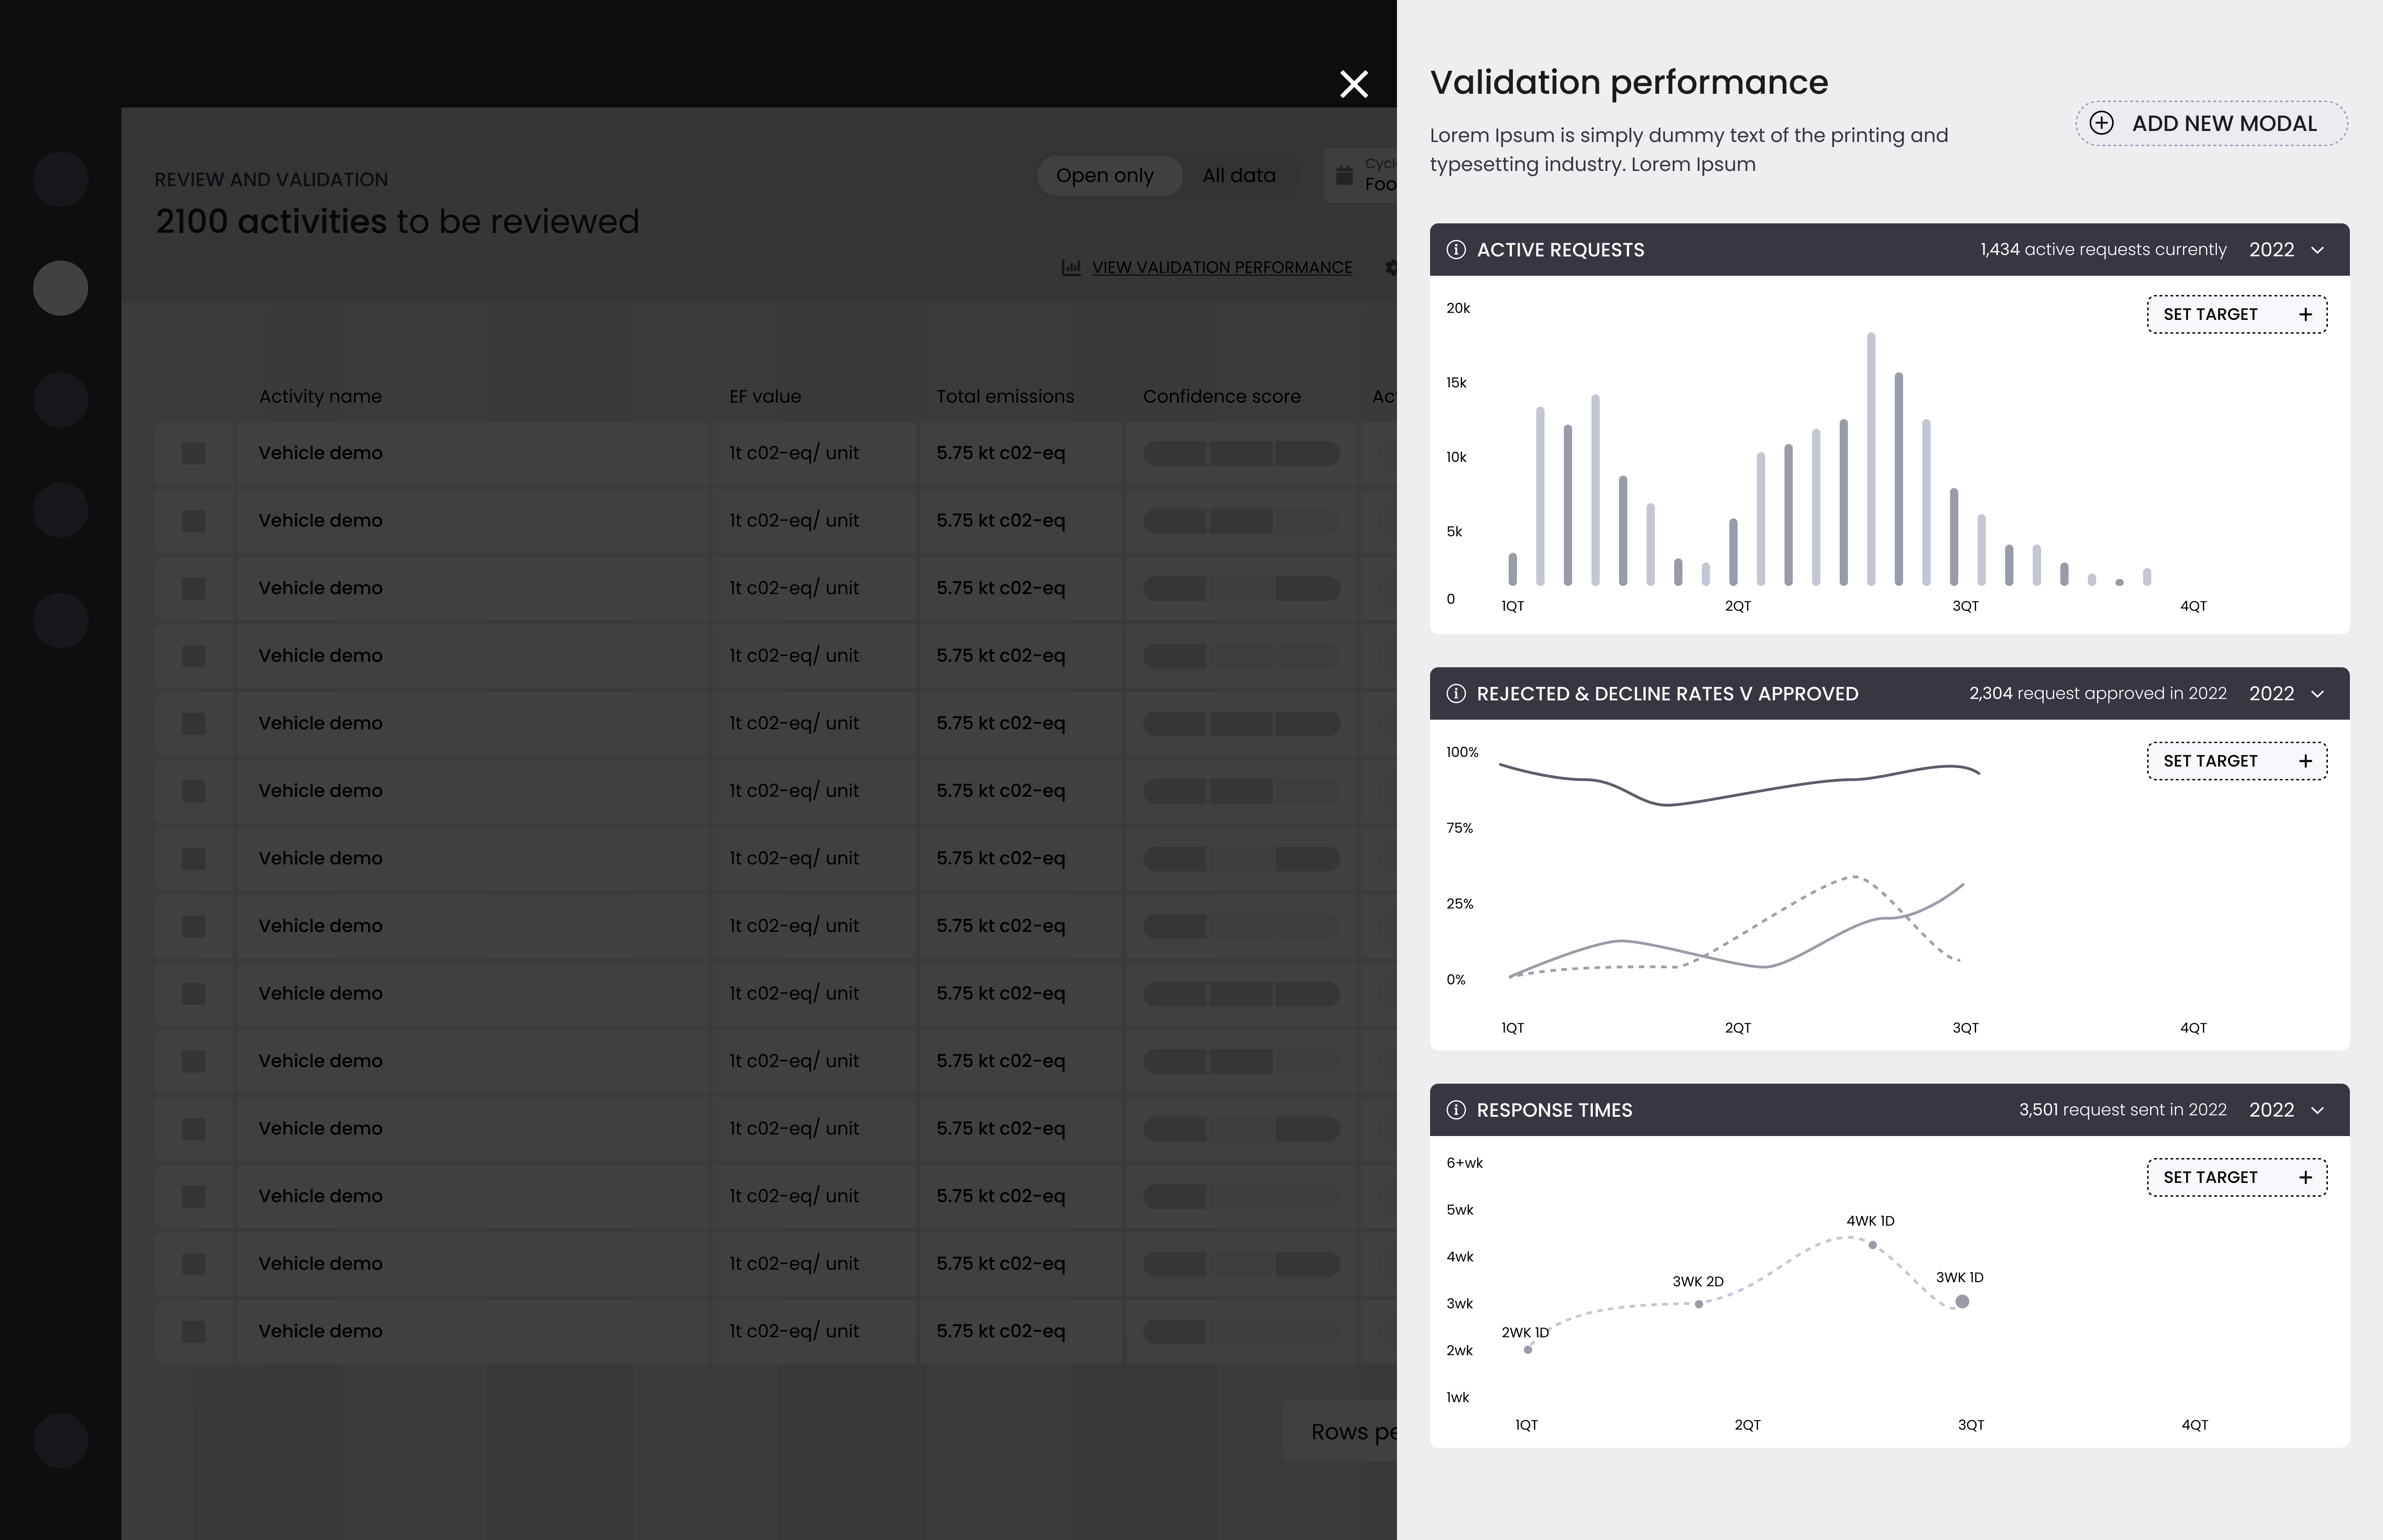
We conducted user testing on the current UI to identify friction points. You can see the current state of the interface below:
Testing with end clients revealed a number of consistent friction points:
Information Architecture
Based on testing insights, we restructured the product architecture — focusing on navigation flow, data interaction, and collaboration features.
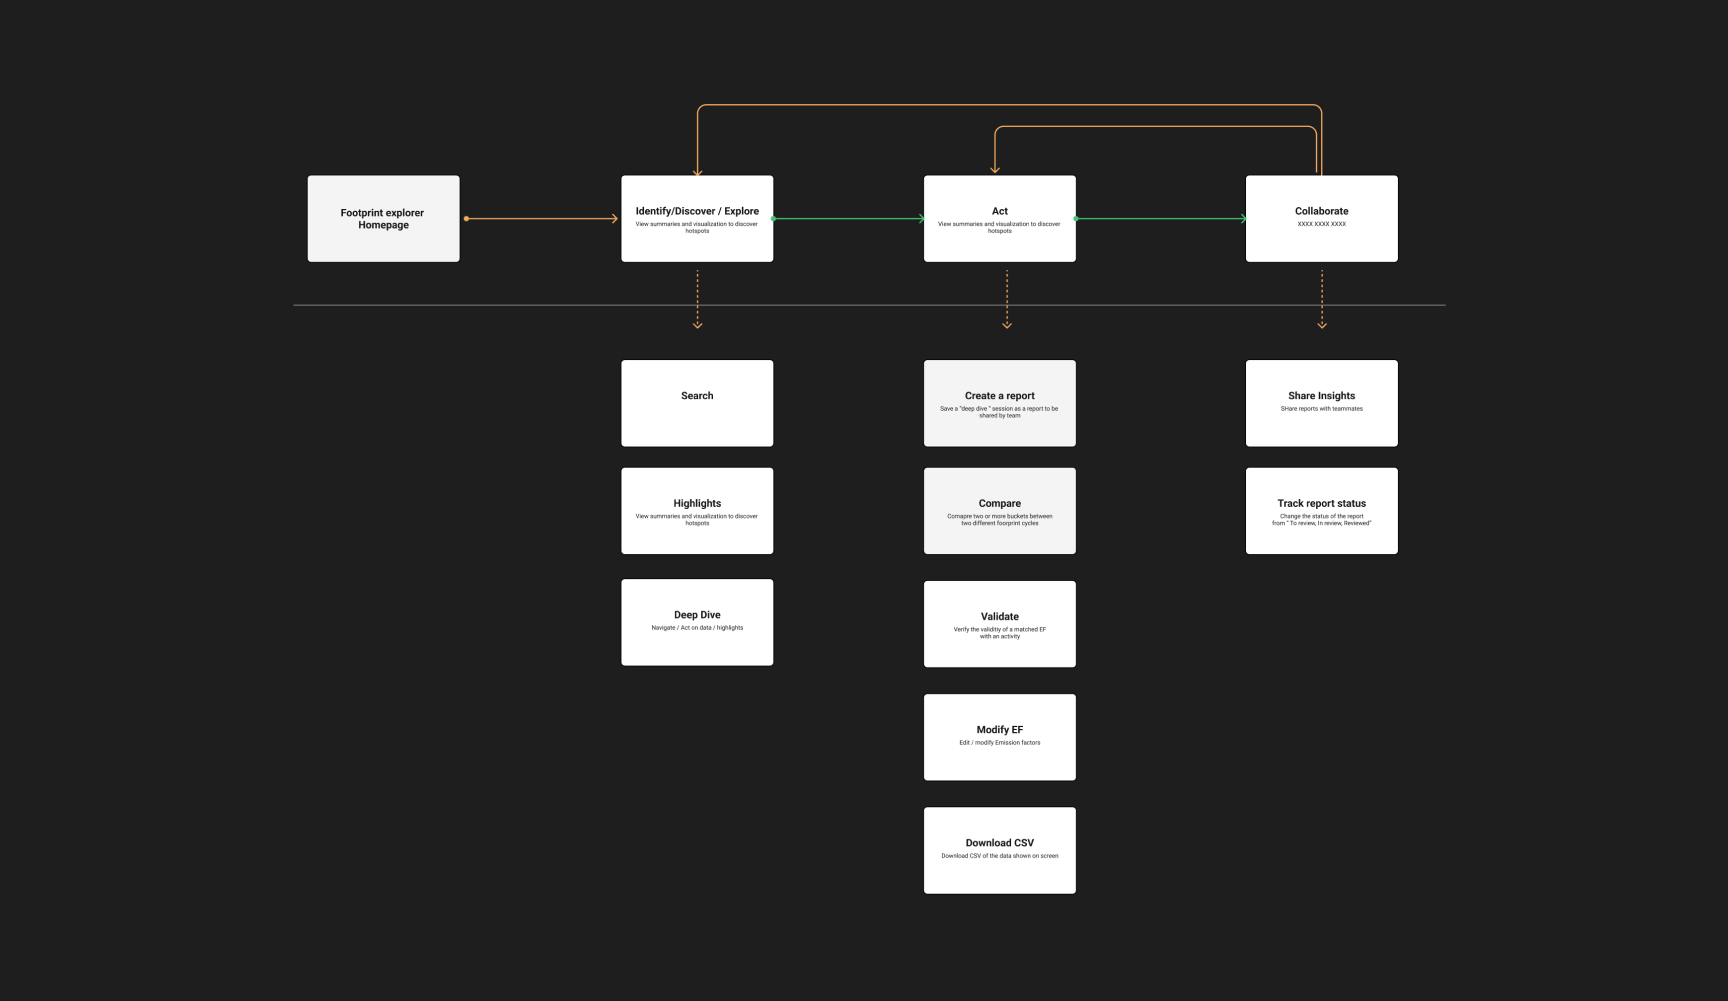
Streamlined Navigation
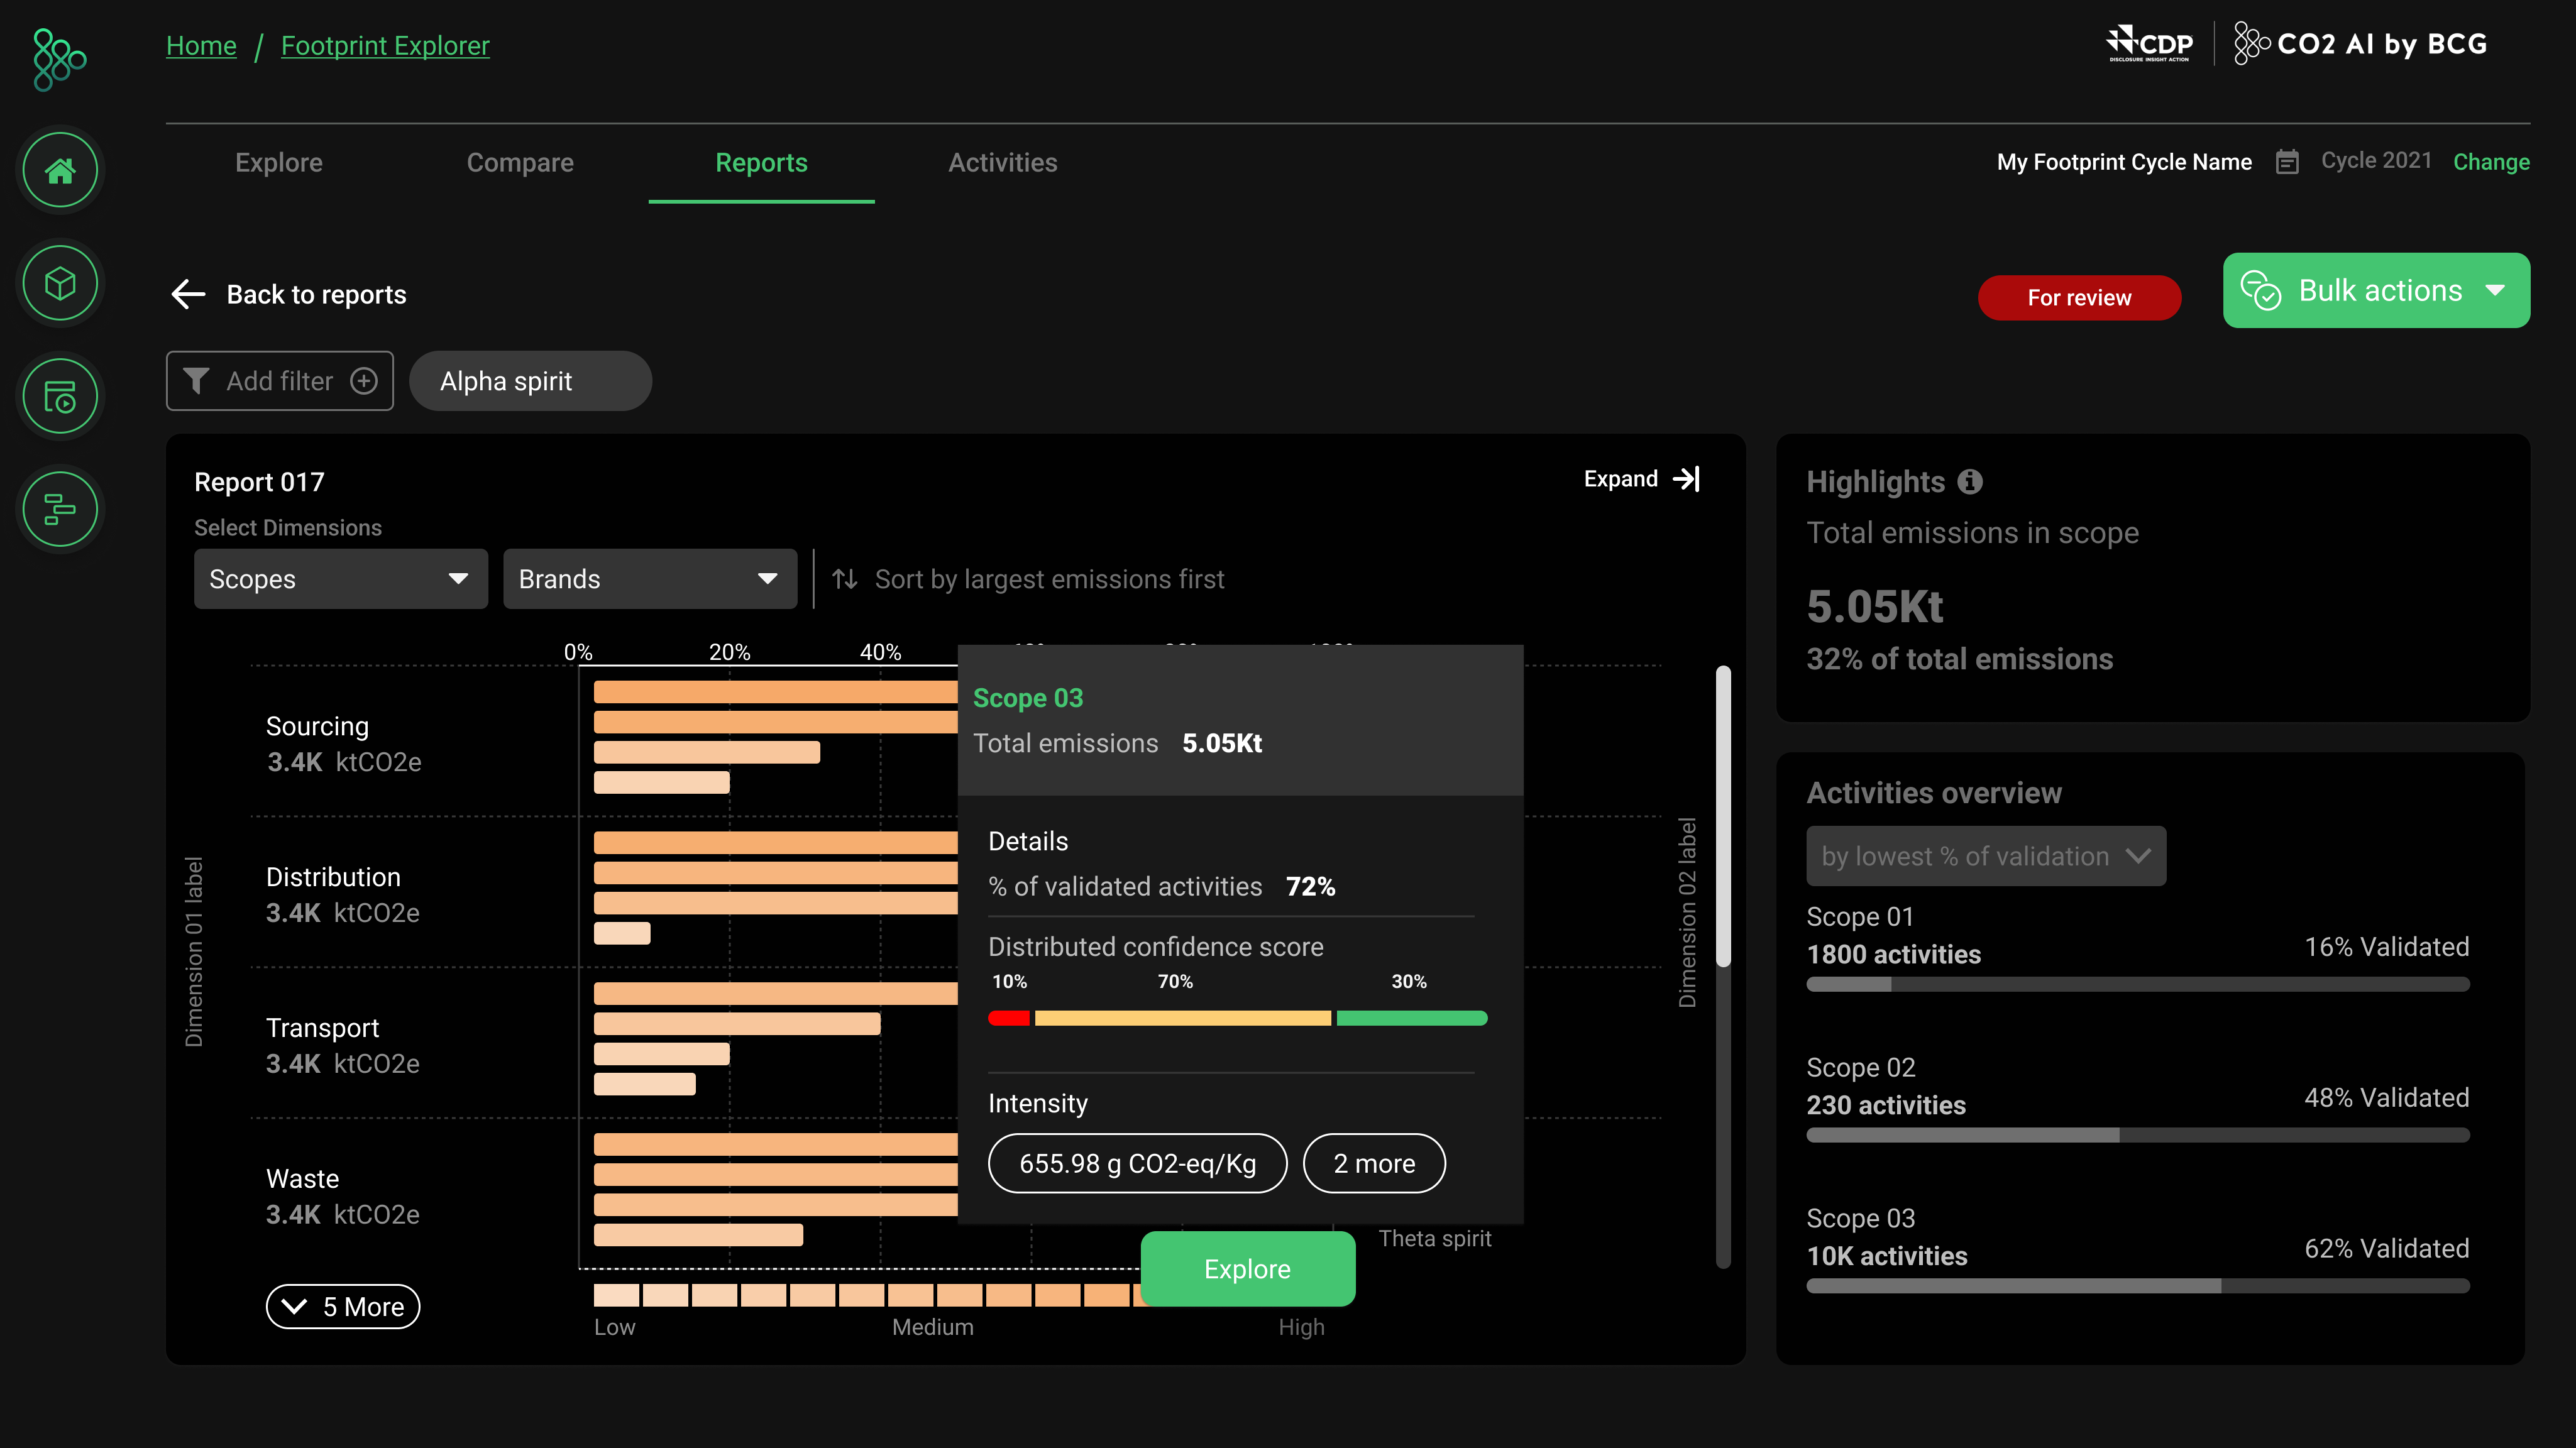
The Identify/Discover/Explore phase provides direct access to summaries and data from the homepage, immersing users in relevant information immediately.
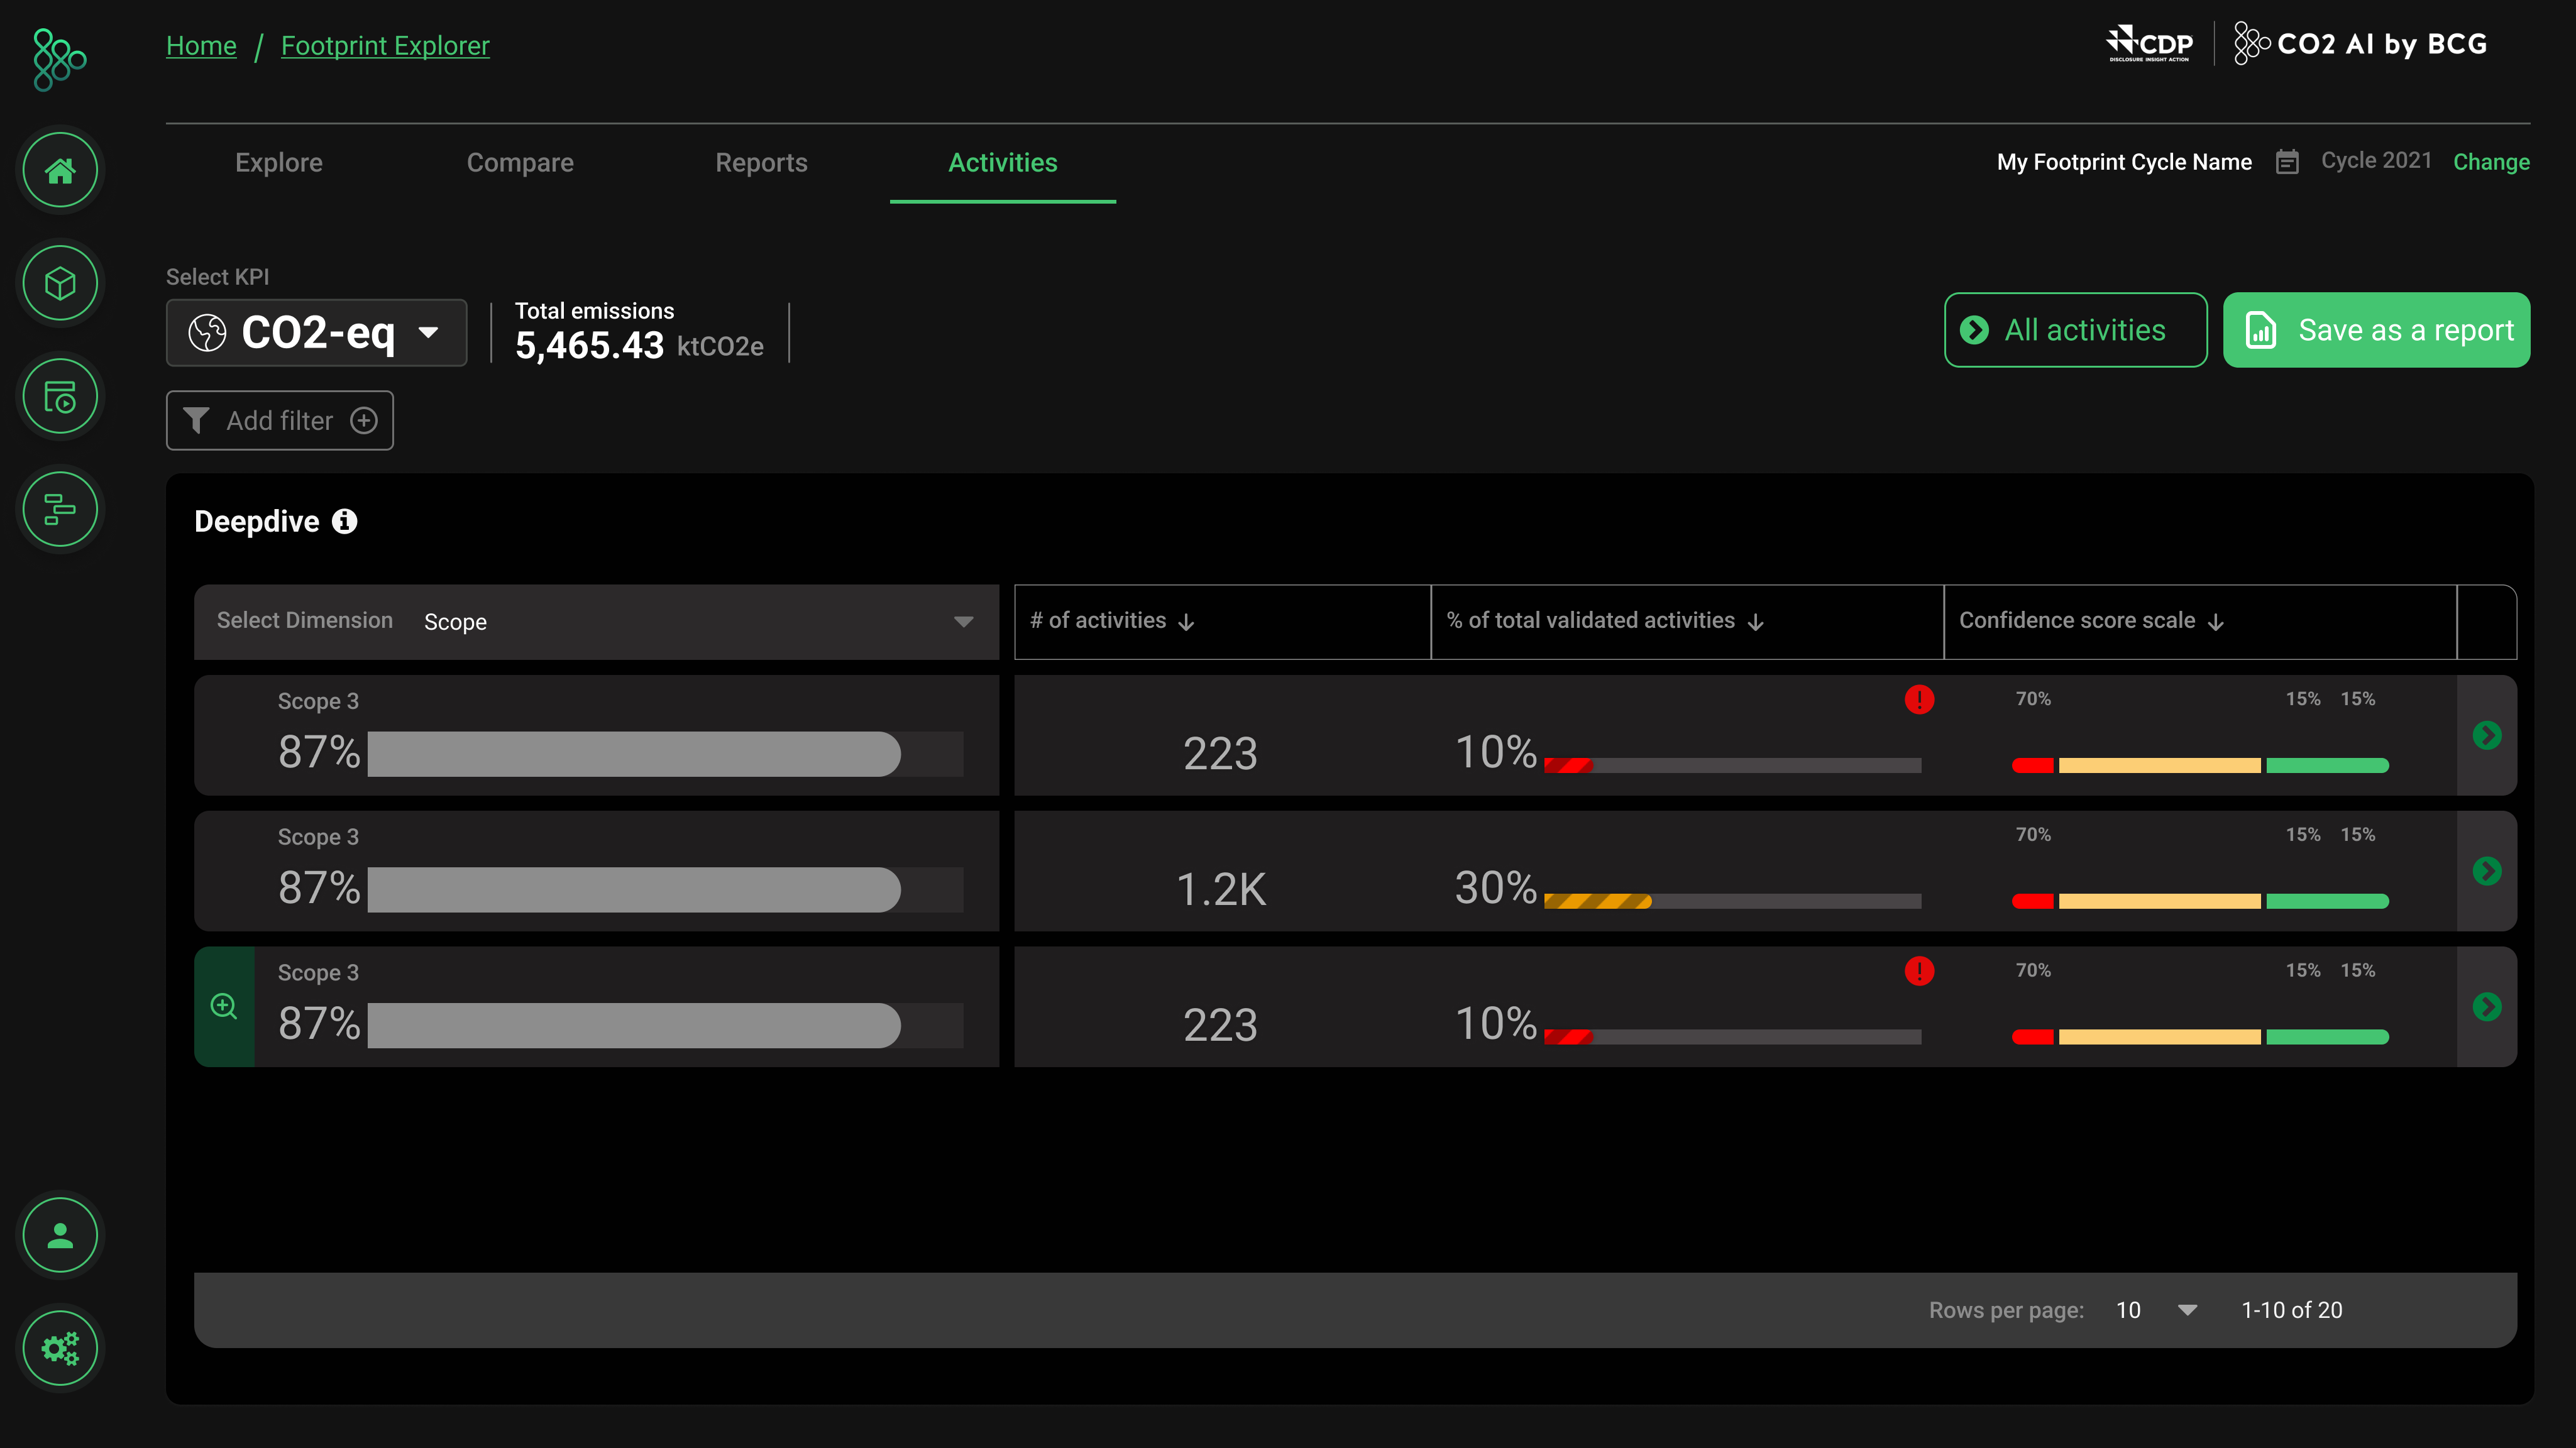
Enhanced Data Interaction
The Act phase includes Create Report, Compare, Validate, and Modify Emission Factors — enabling seamless transition from data discovery to actionable insights.
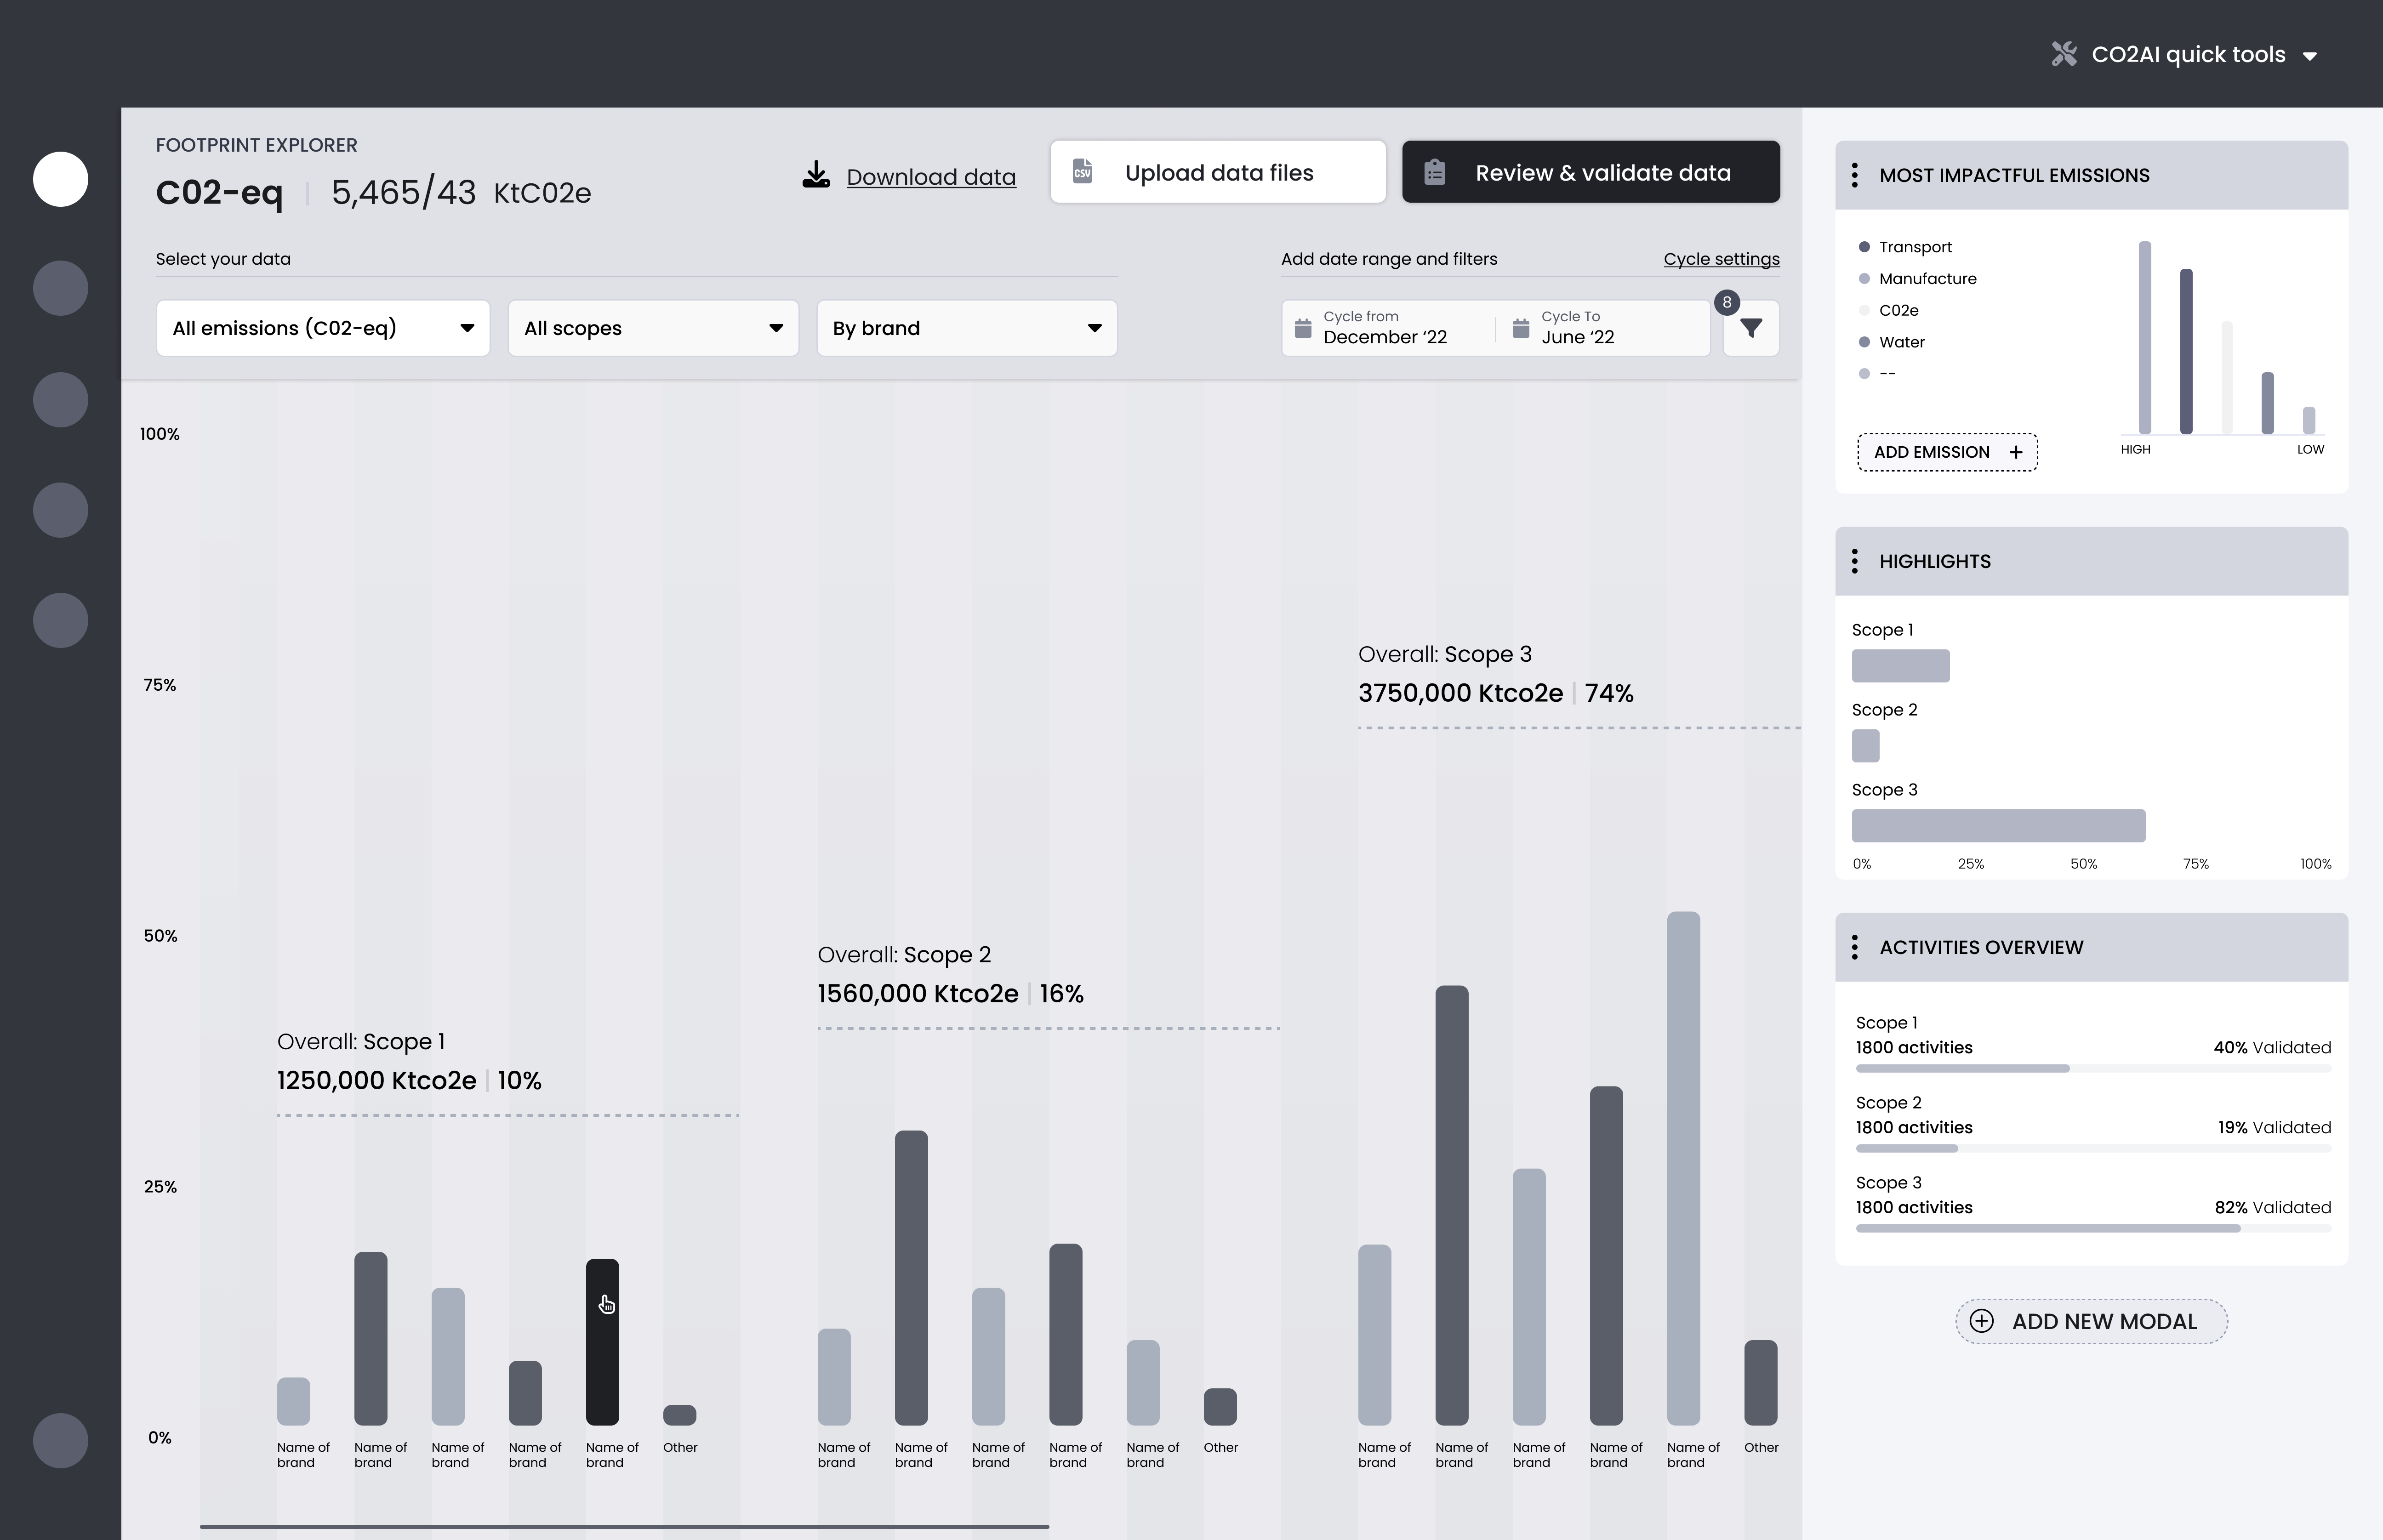
Wireframe Ideation
I translated user research findings into wireframe concepts, exploring solutions for navigation, dashboard customisation, and data visualisation.
With these enhancements defined, I developed wireframes to visualise the new structure and interactions.
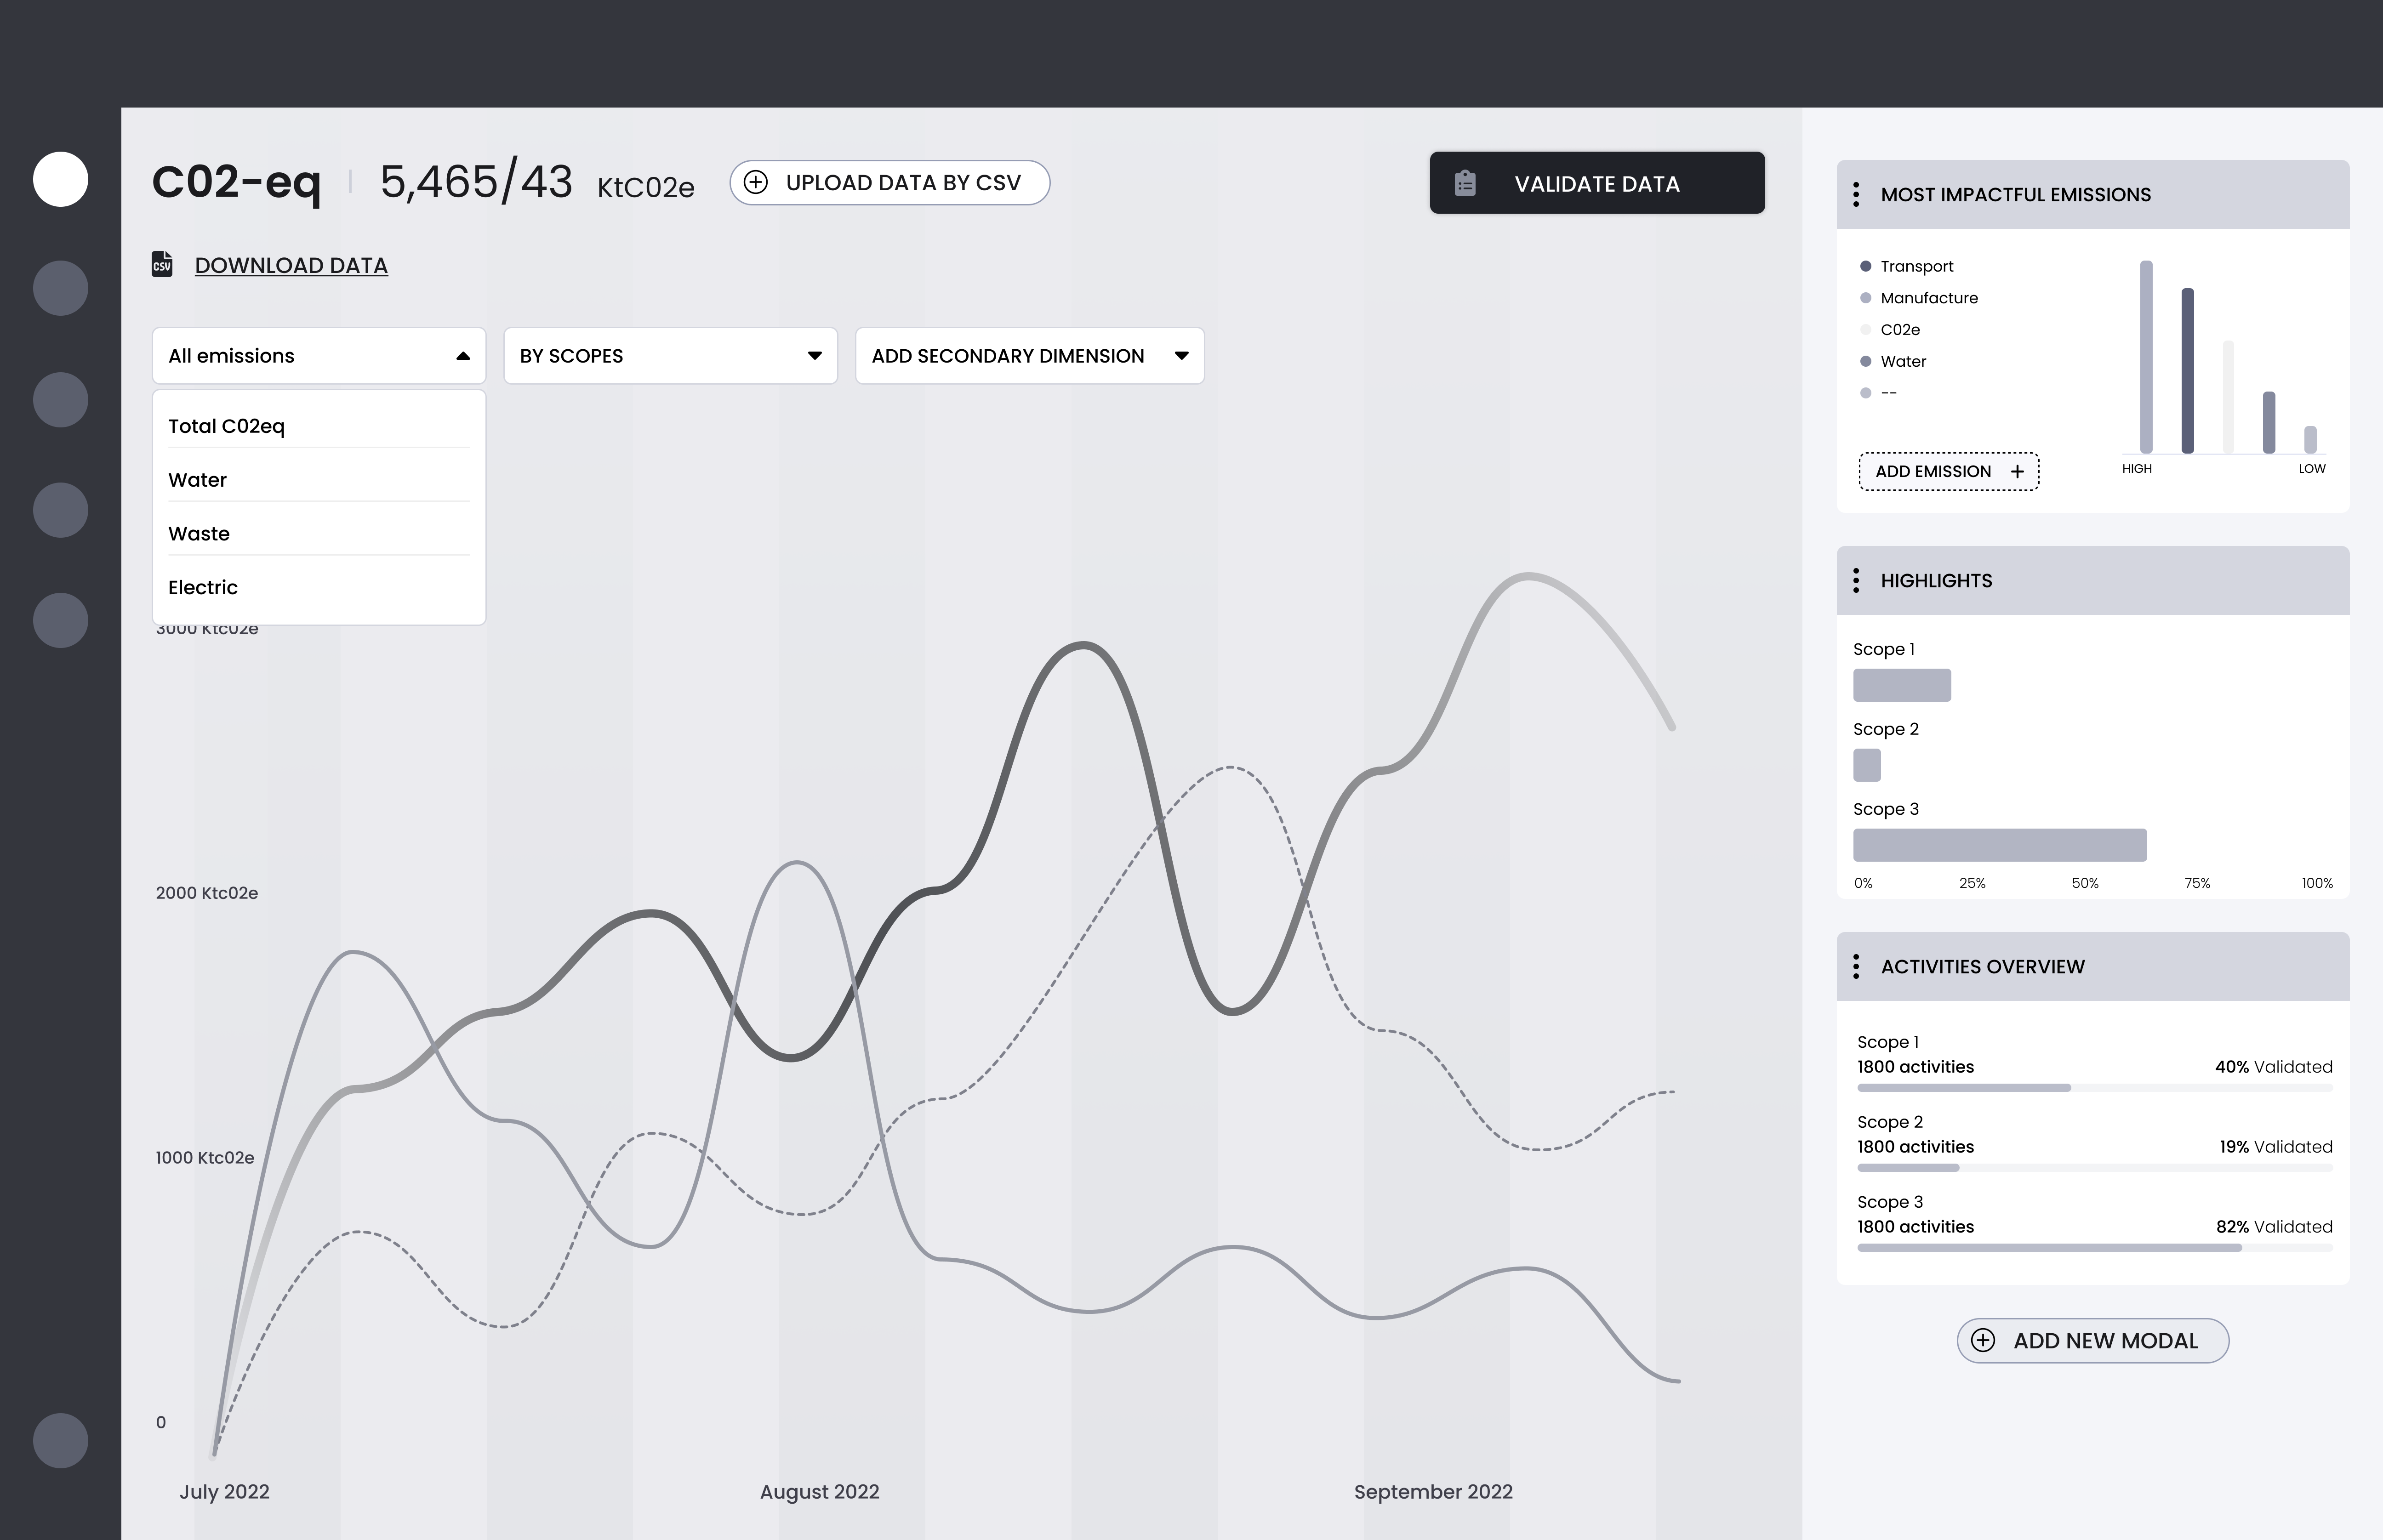
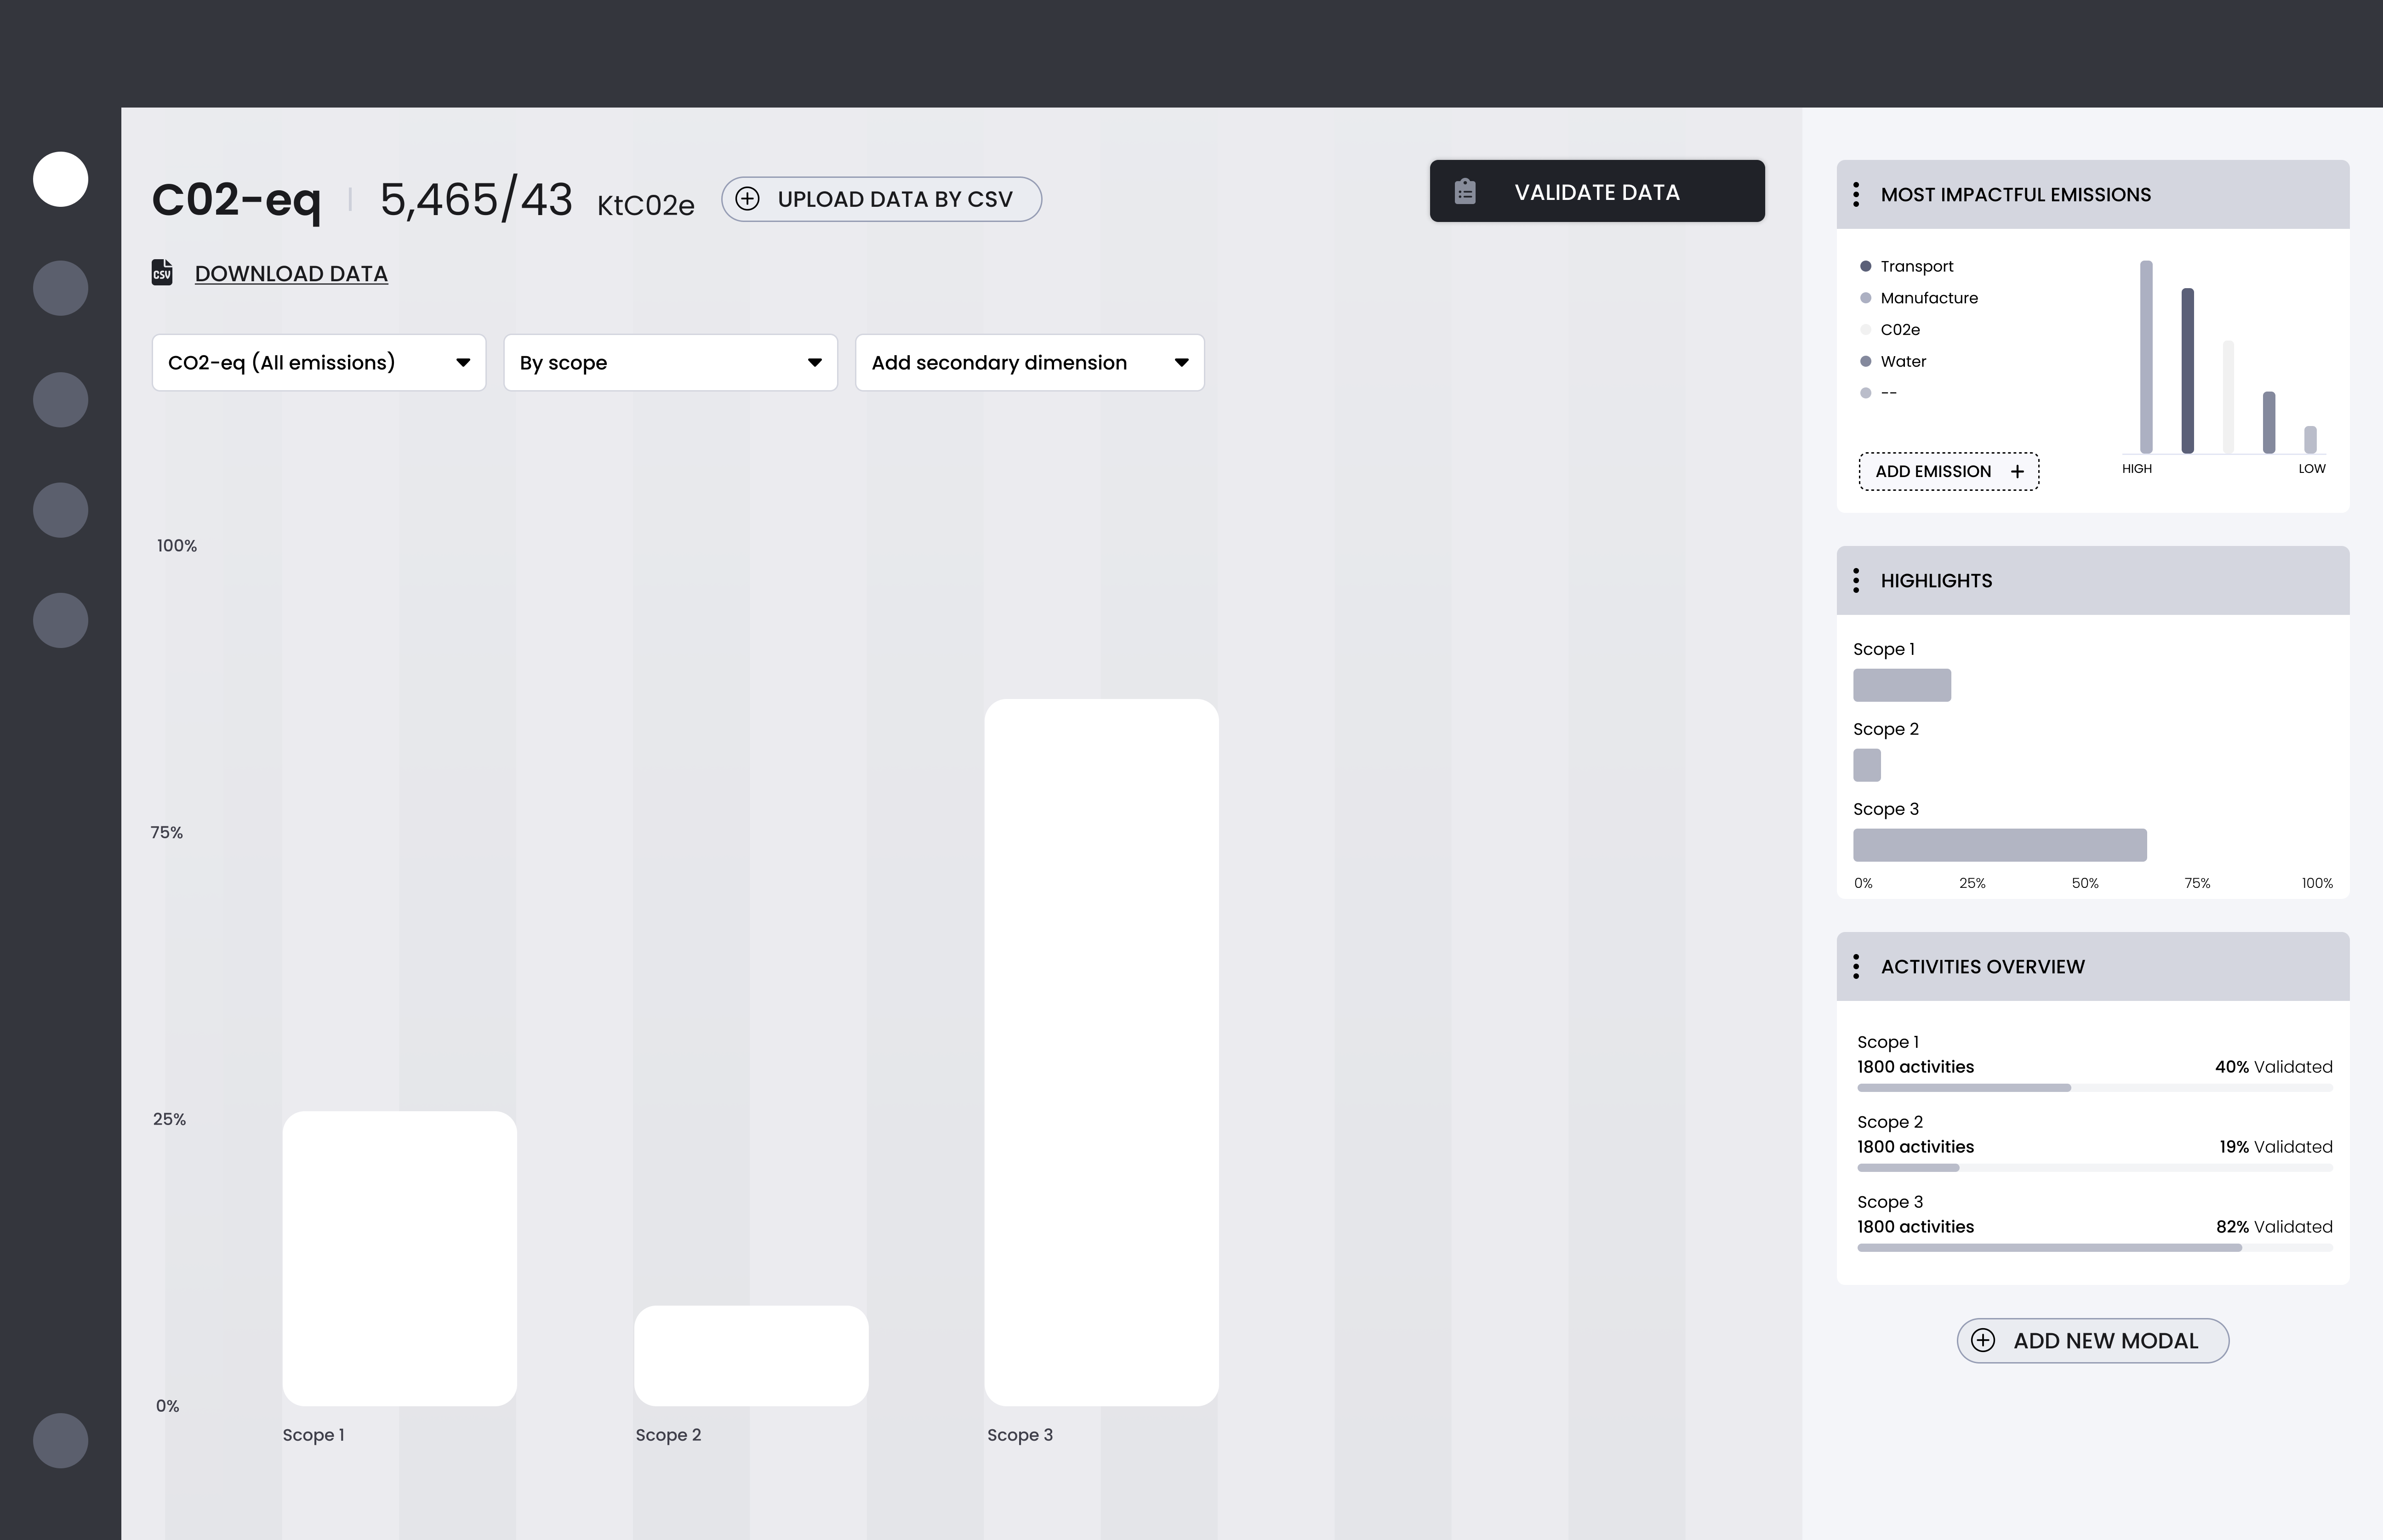
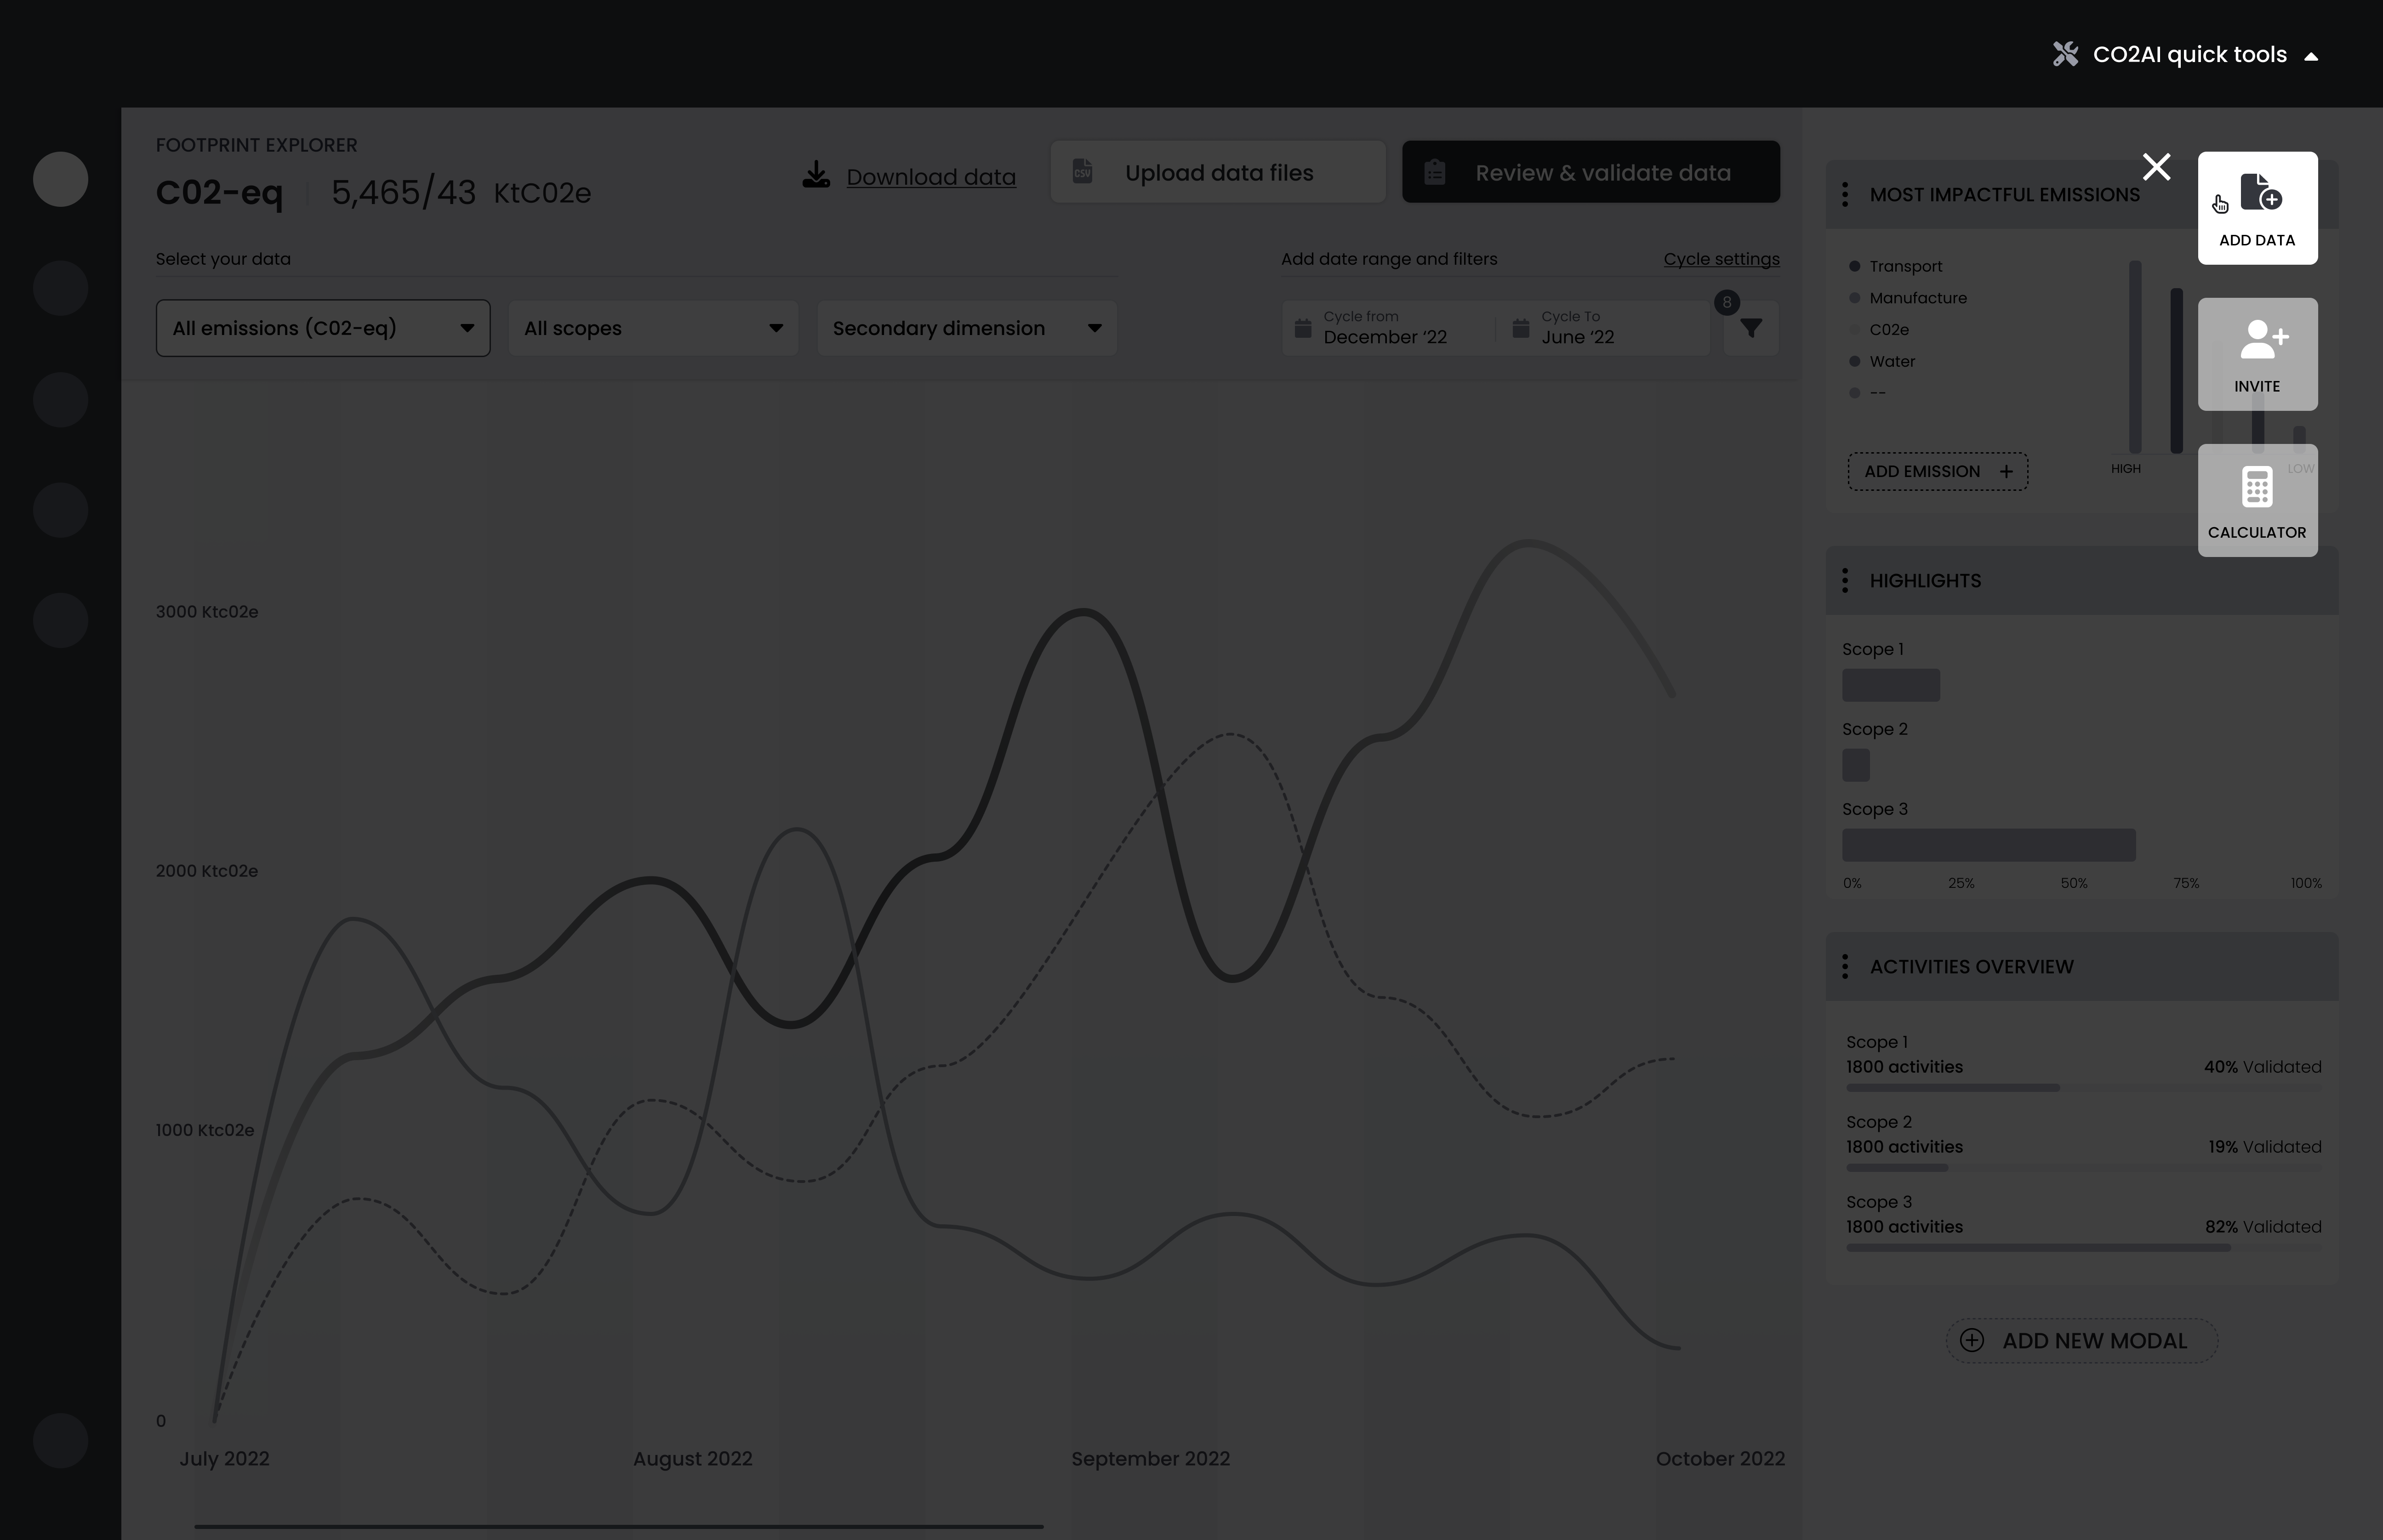
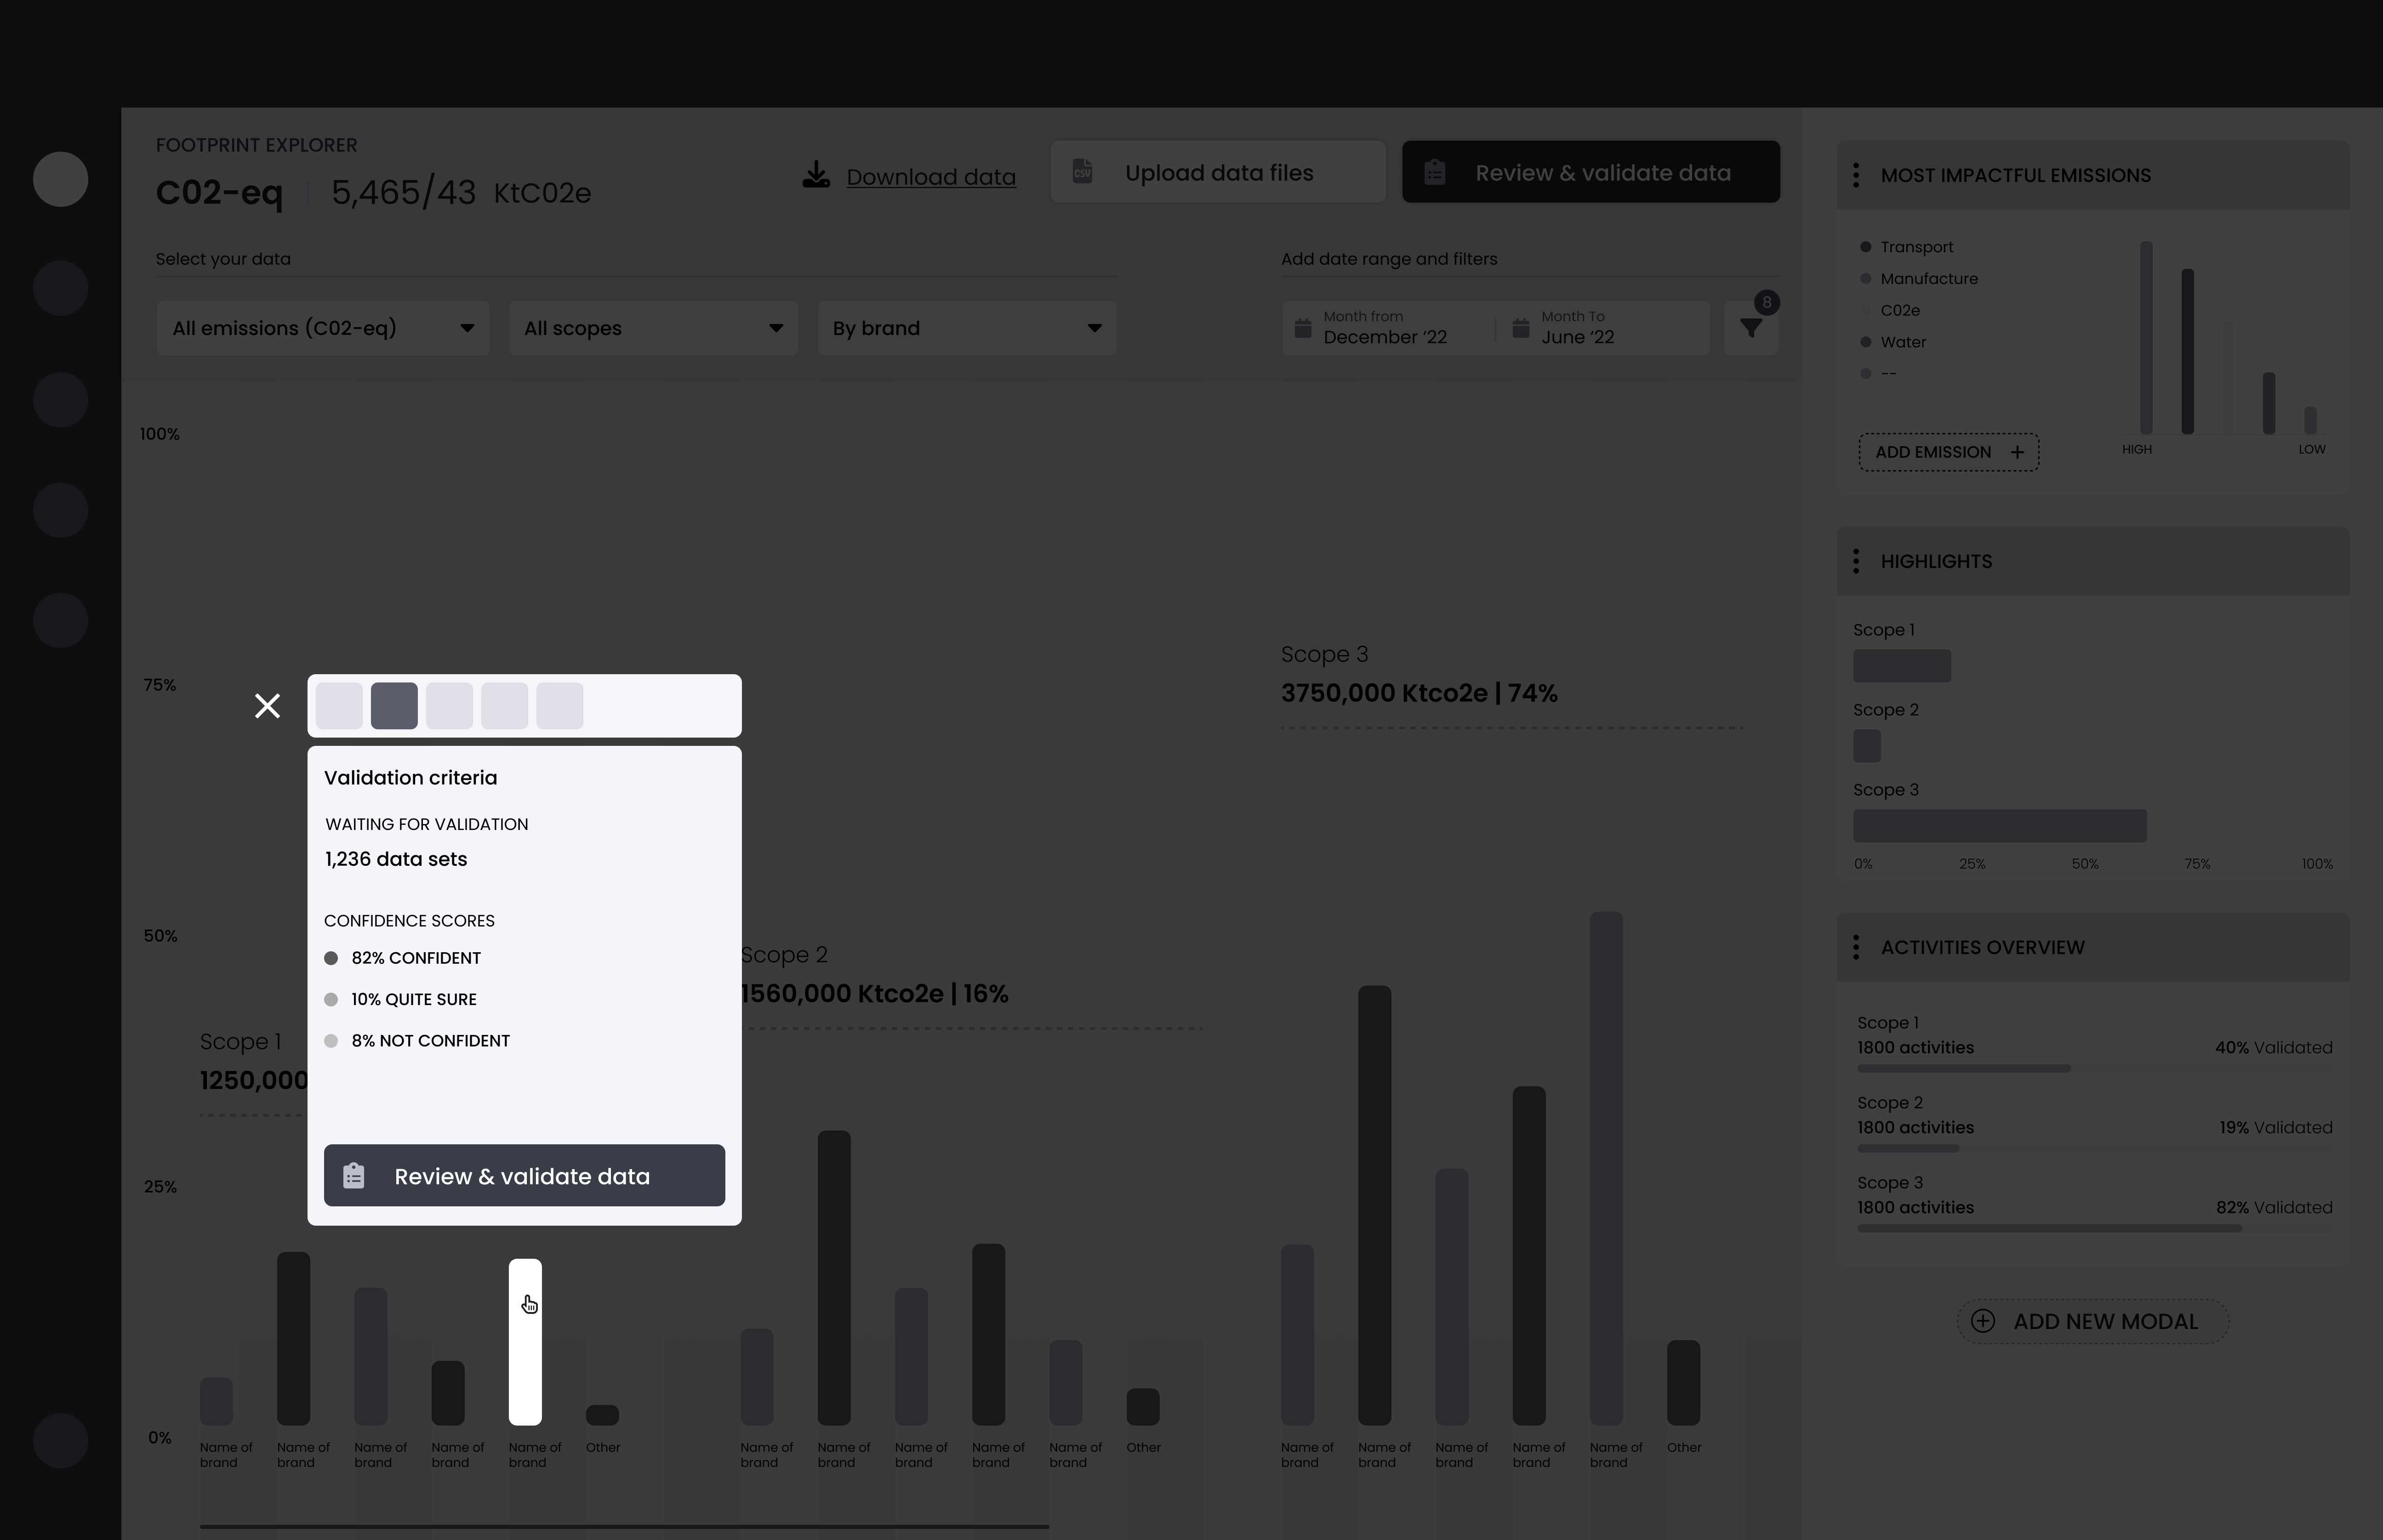
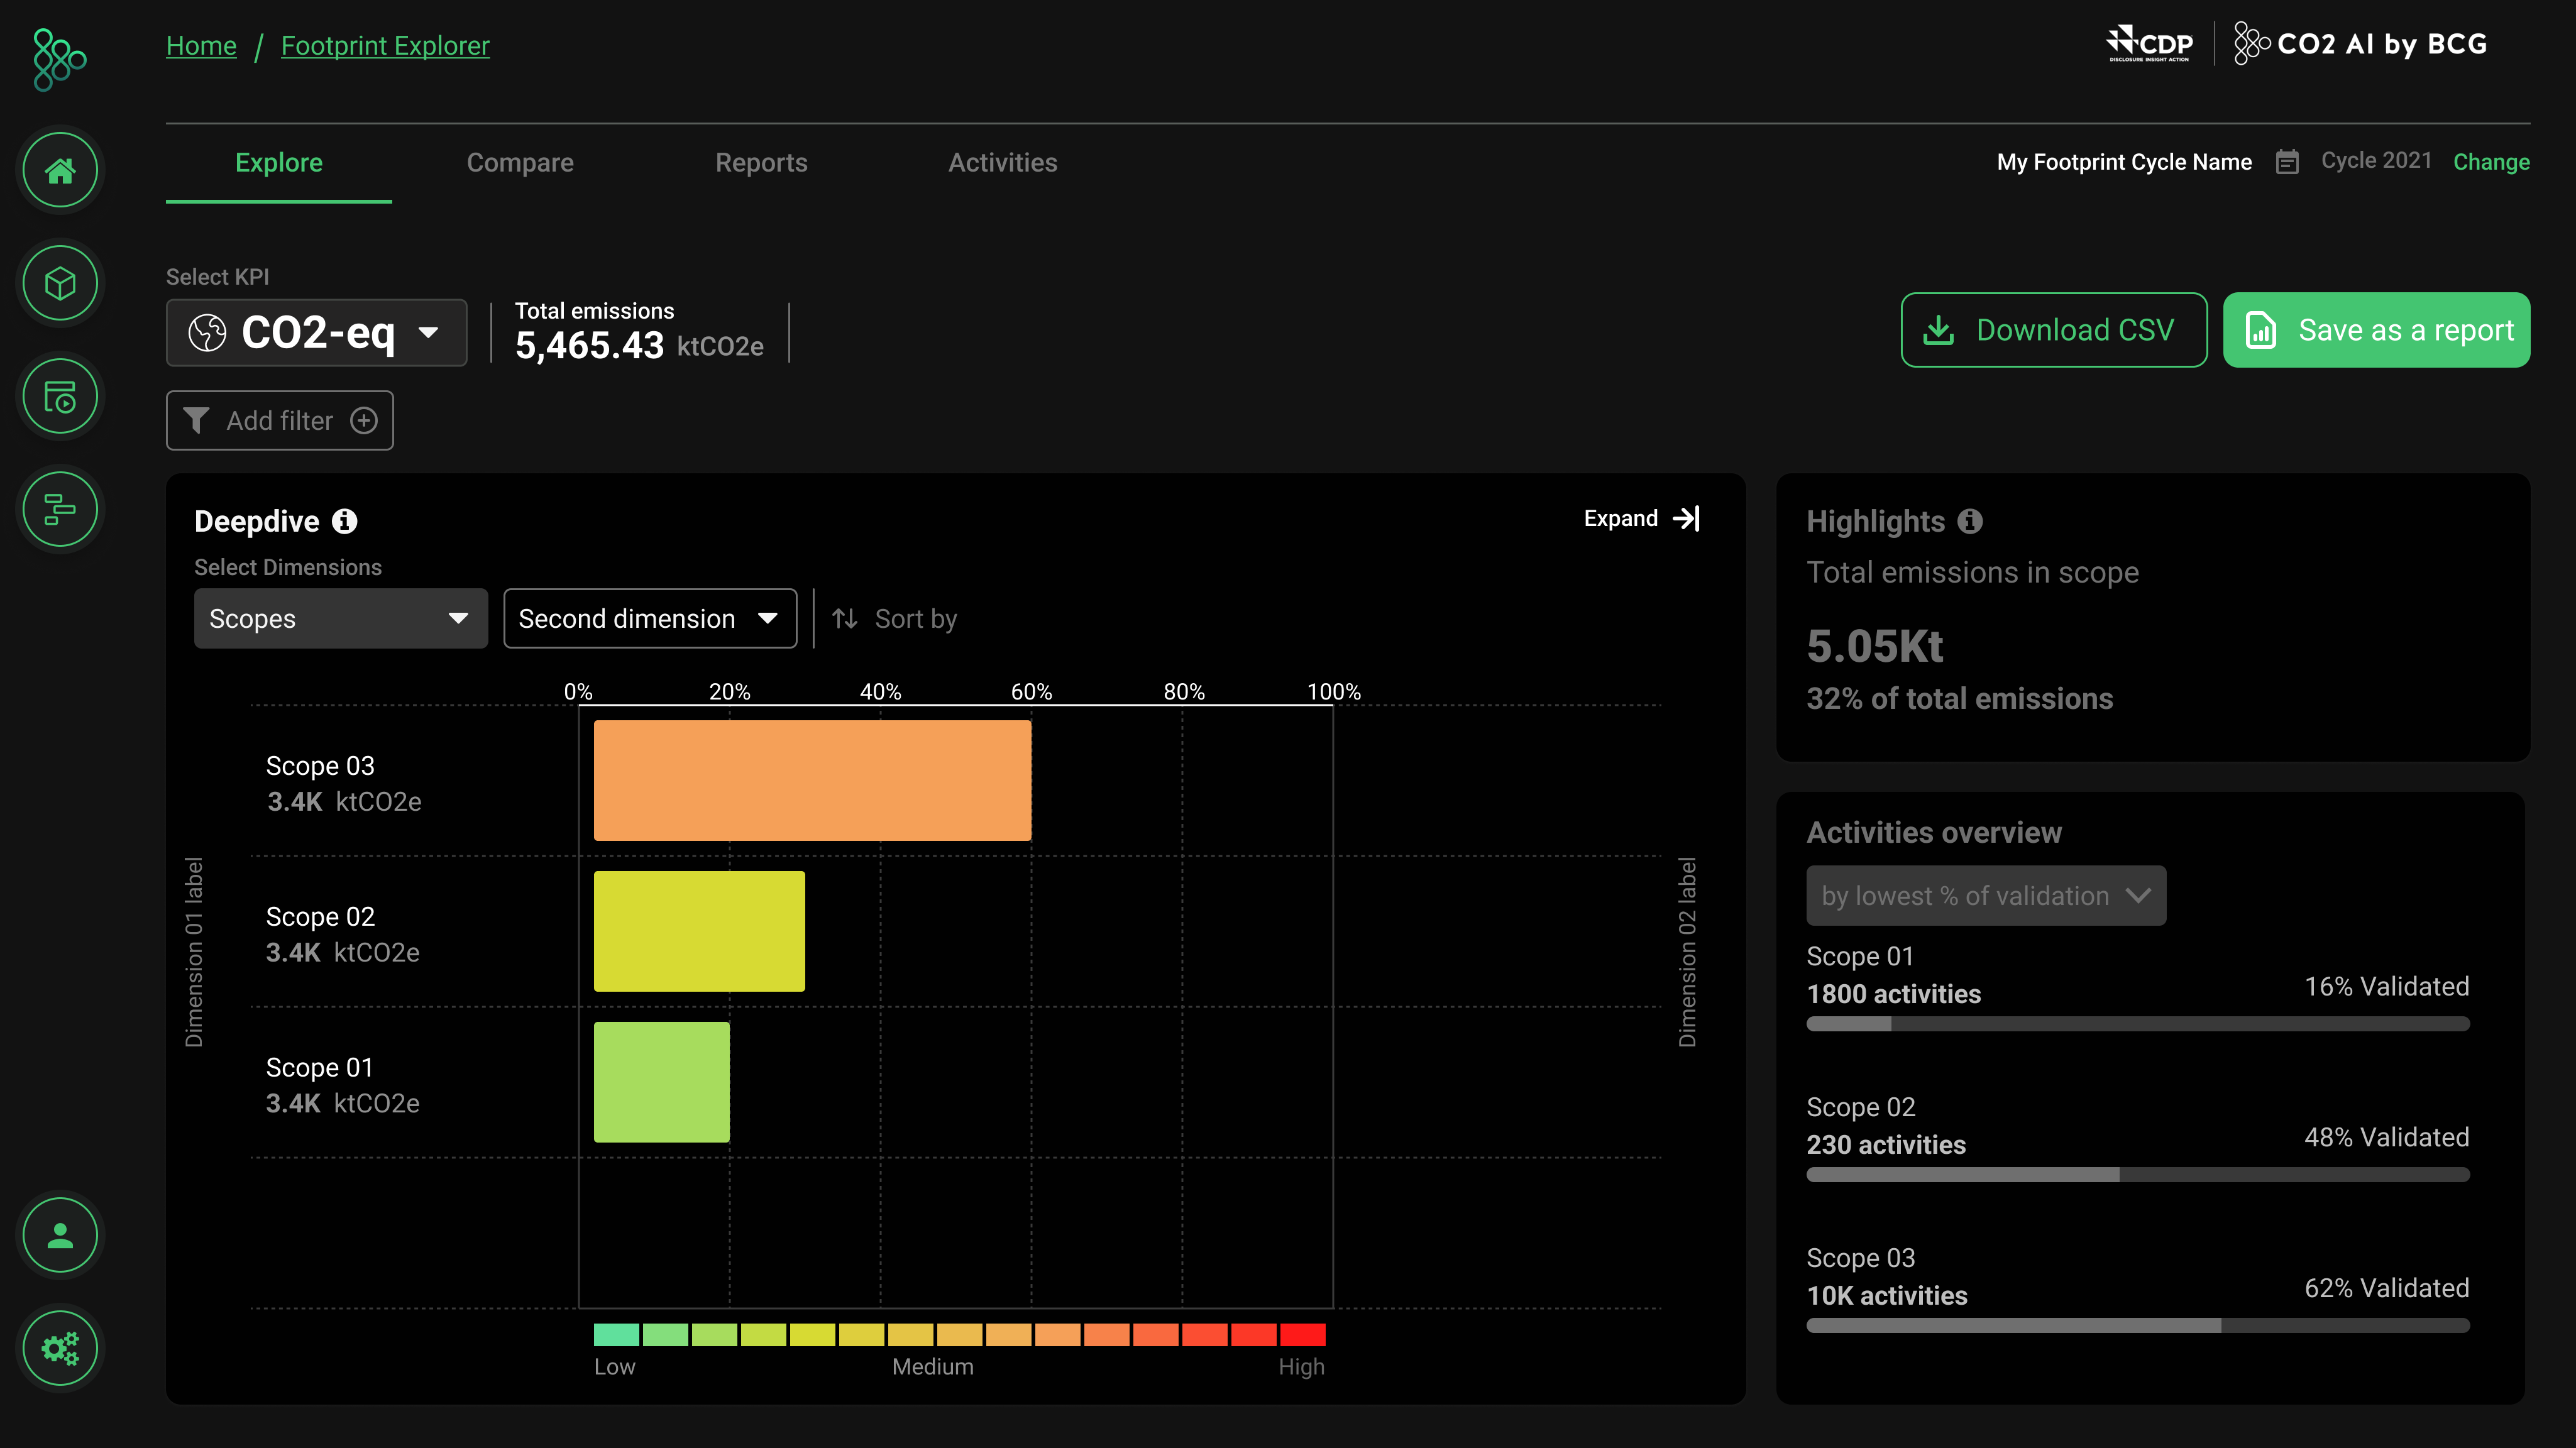
Time Series Dashboard
Line graph visualization showing CO2 emissions over time with filtering by emission type, scopes, and secondary dimensions. Right panel displays highlights and activity overview.
The head office concept focused on visual hierarchy while portraying a zoomed-out view of life — helping leadership understand their role in sustainability. The globe provides a high-level, memorable experience.
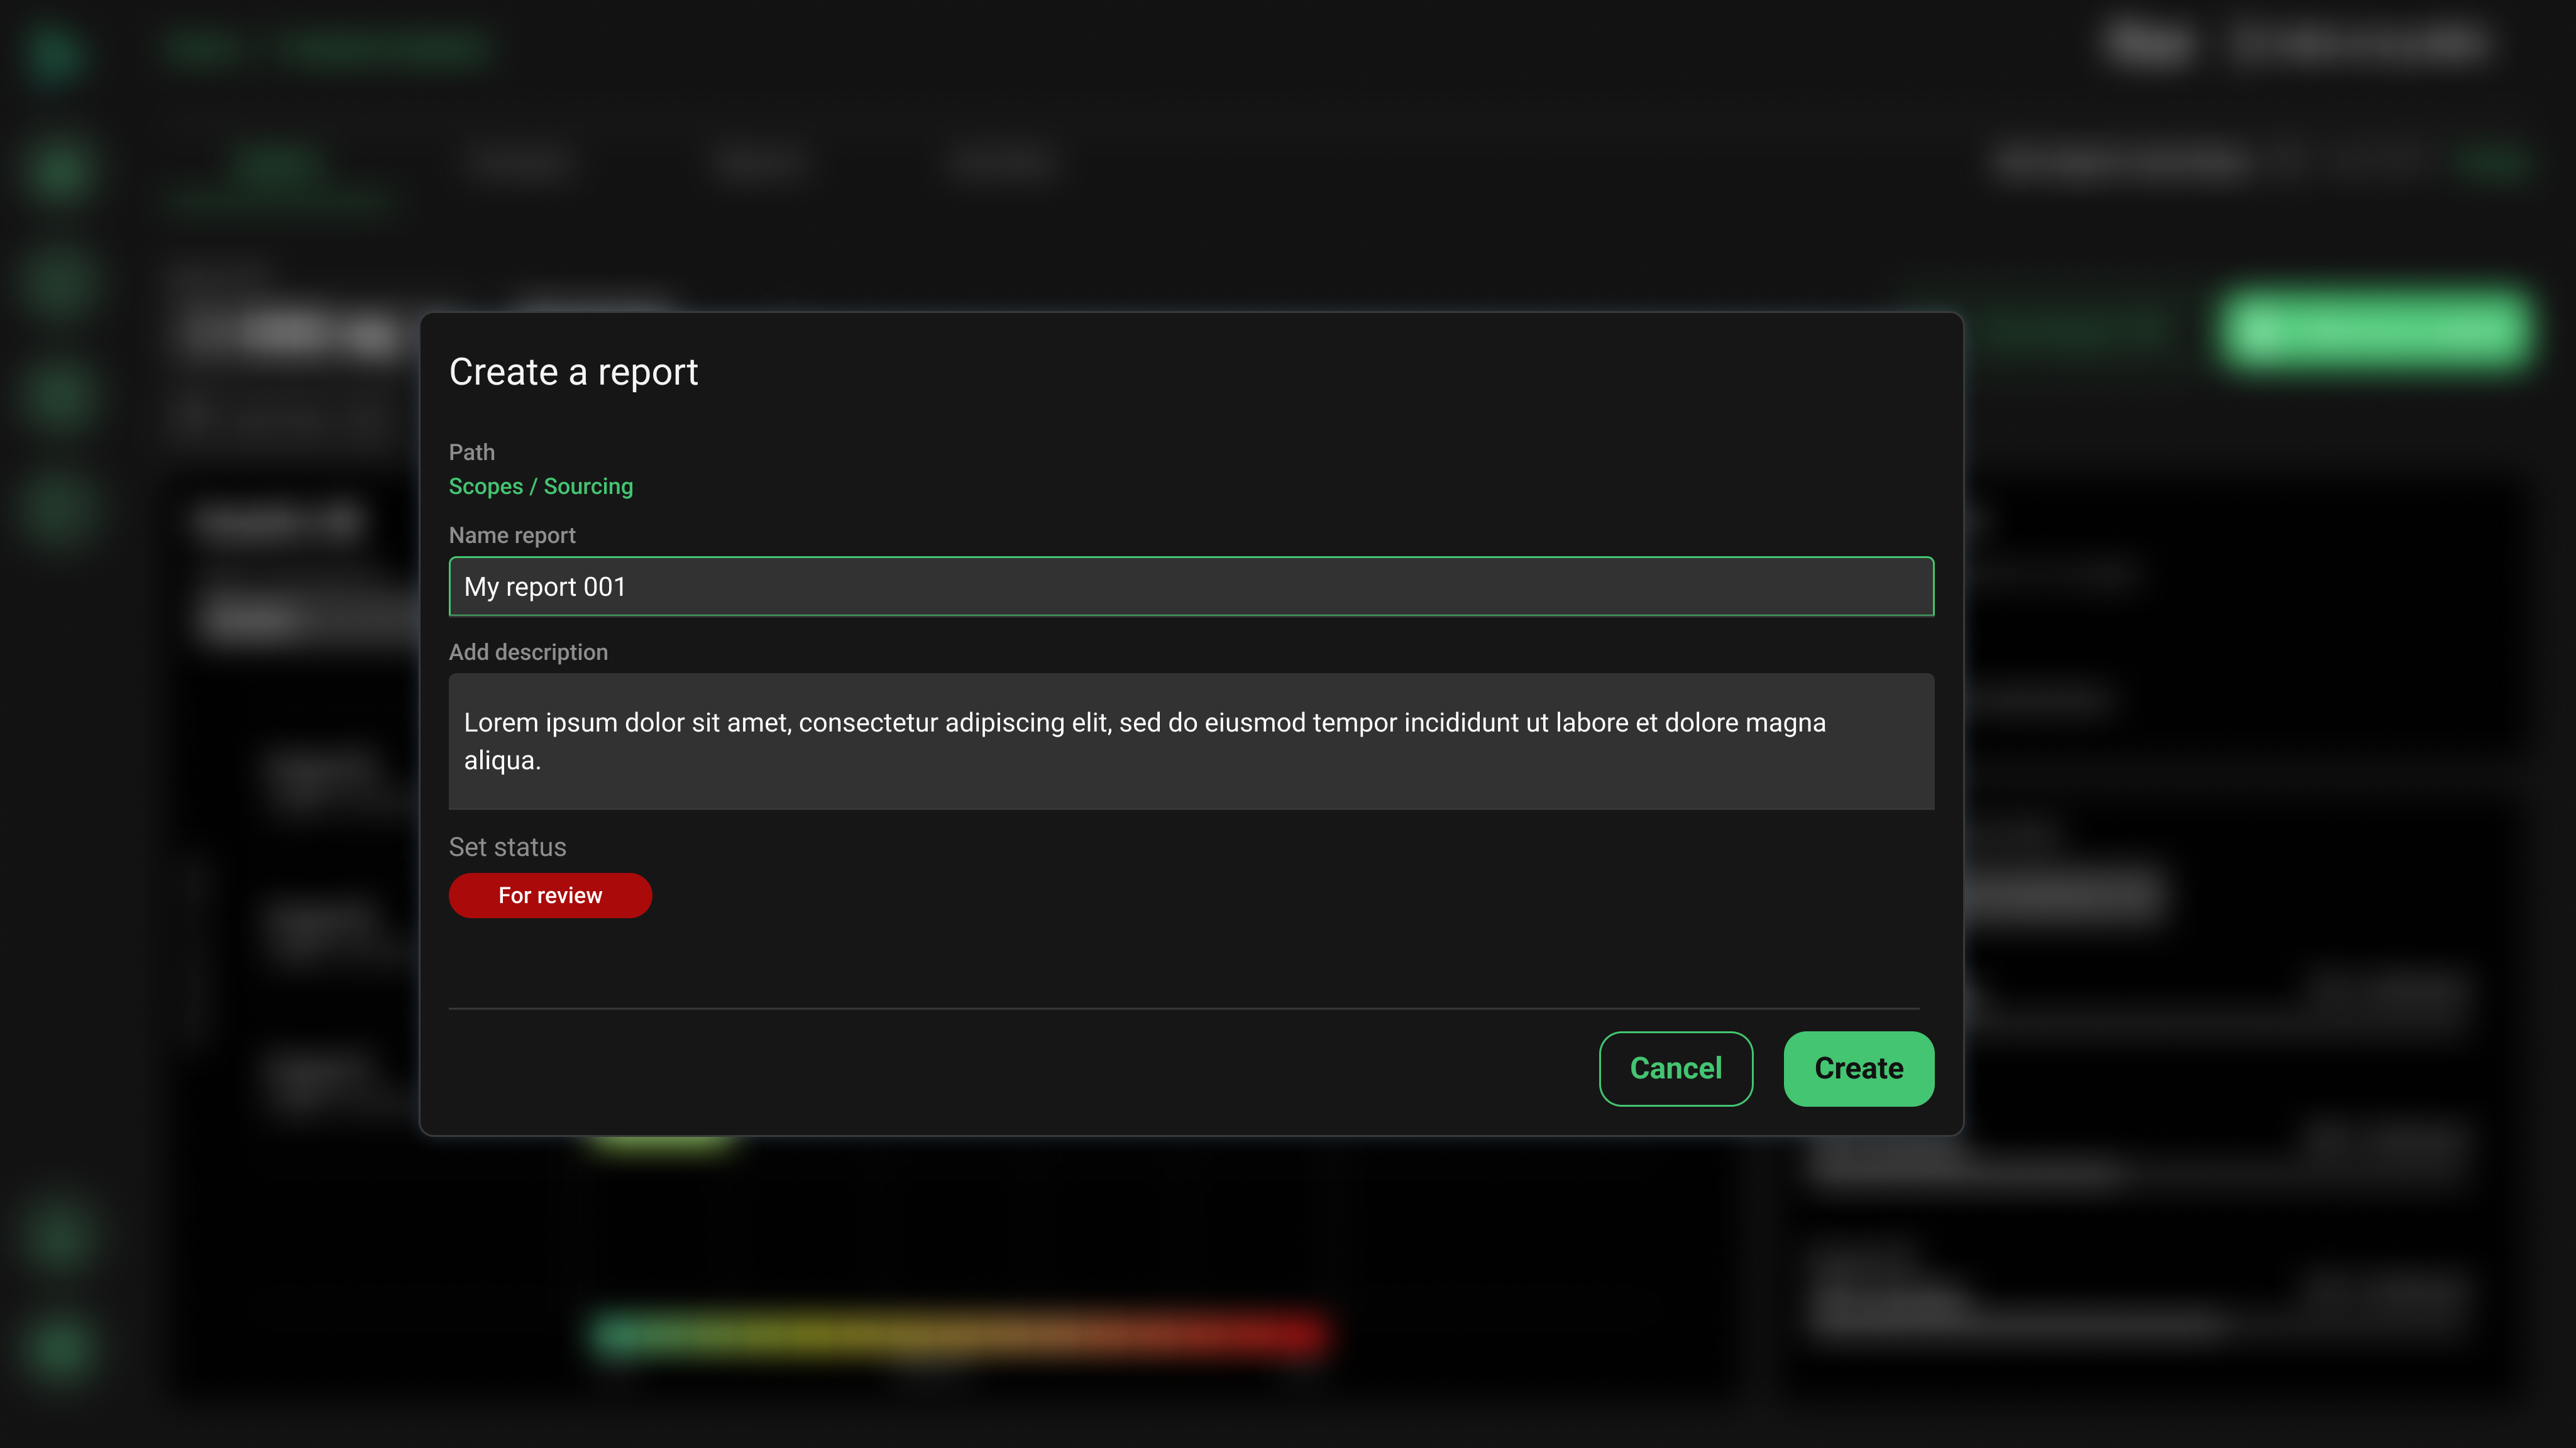
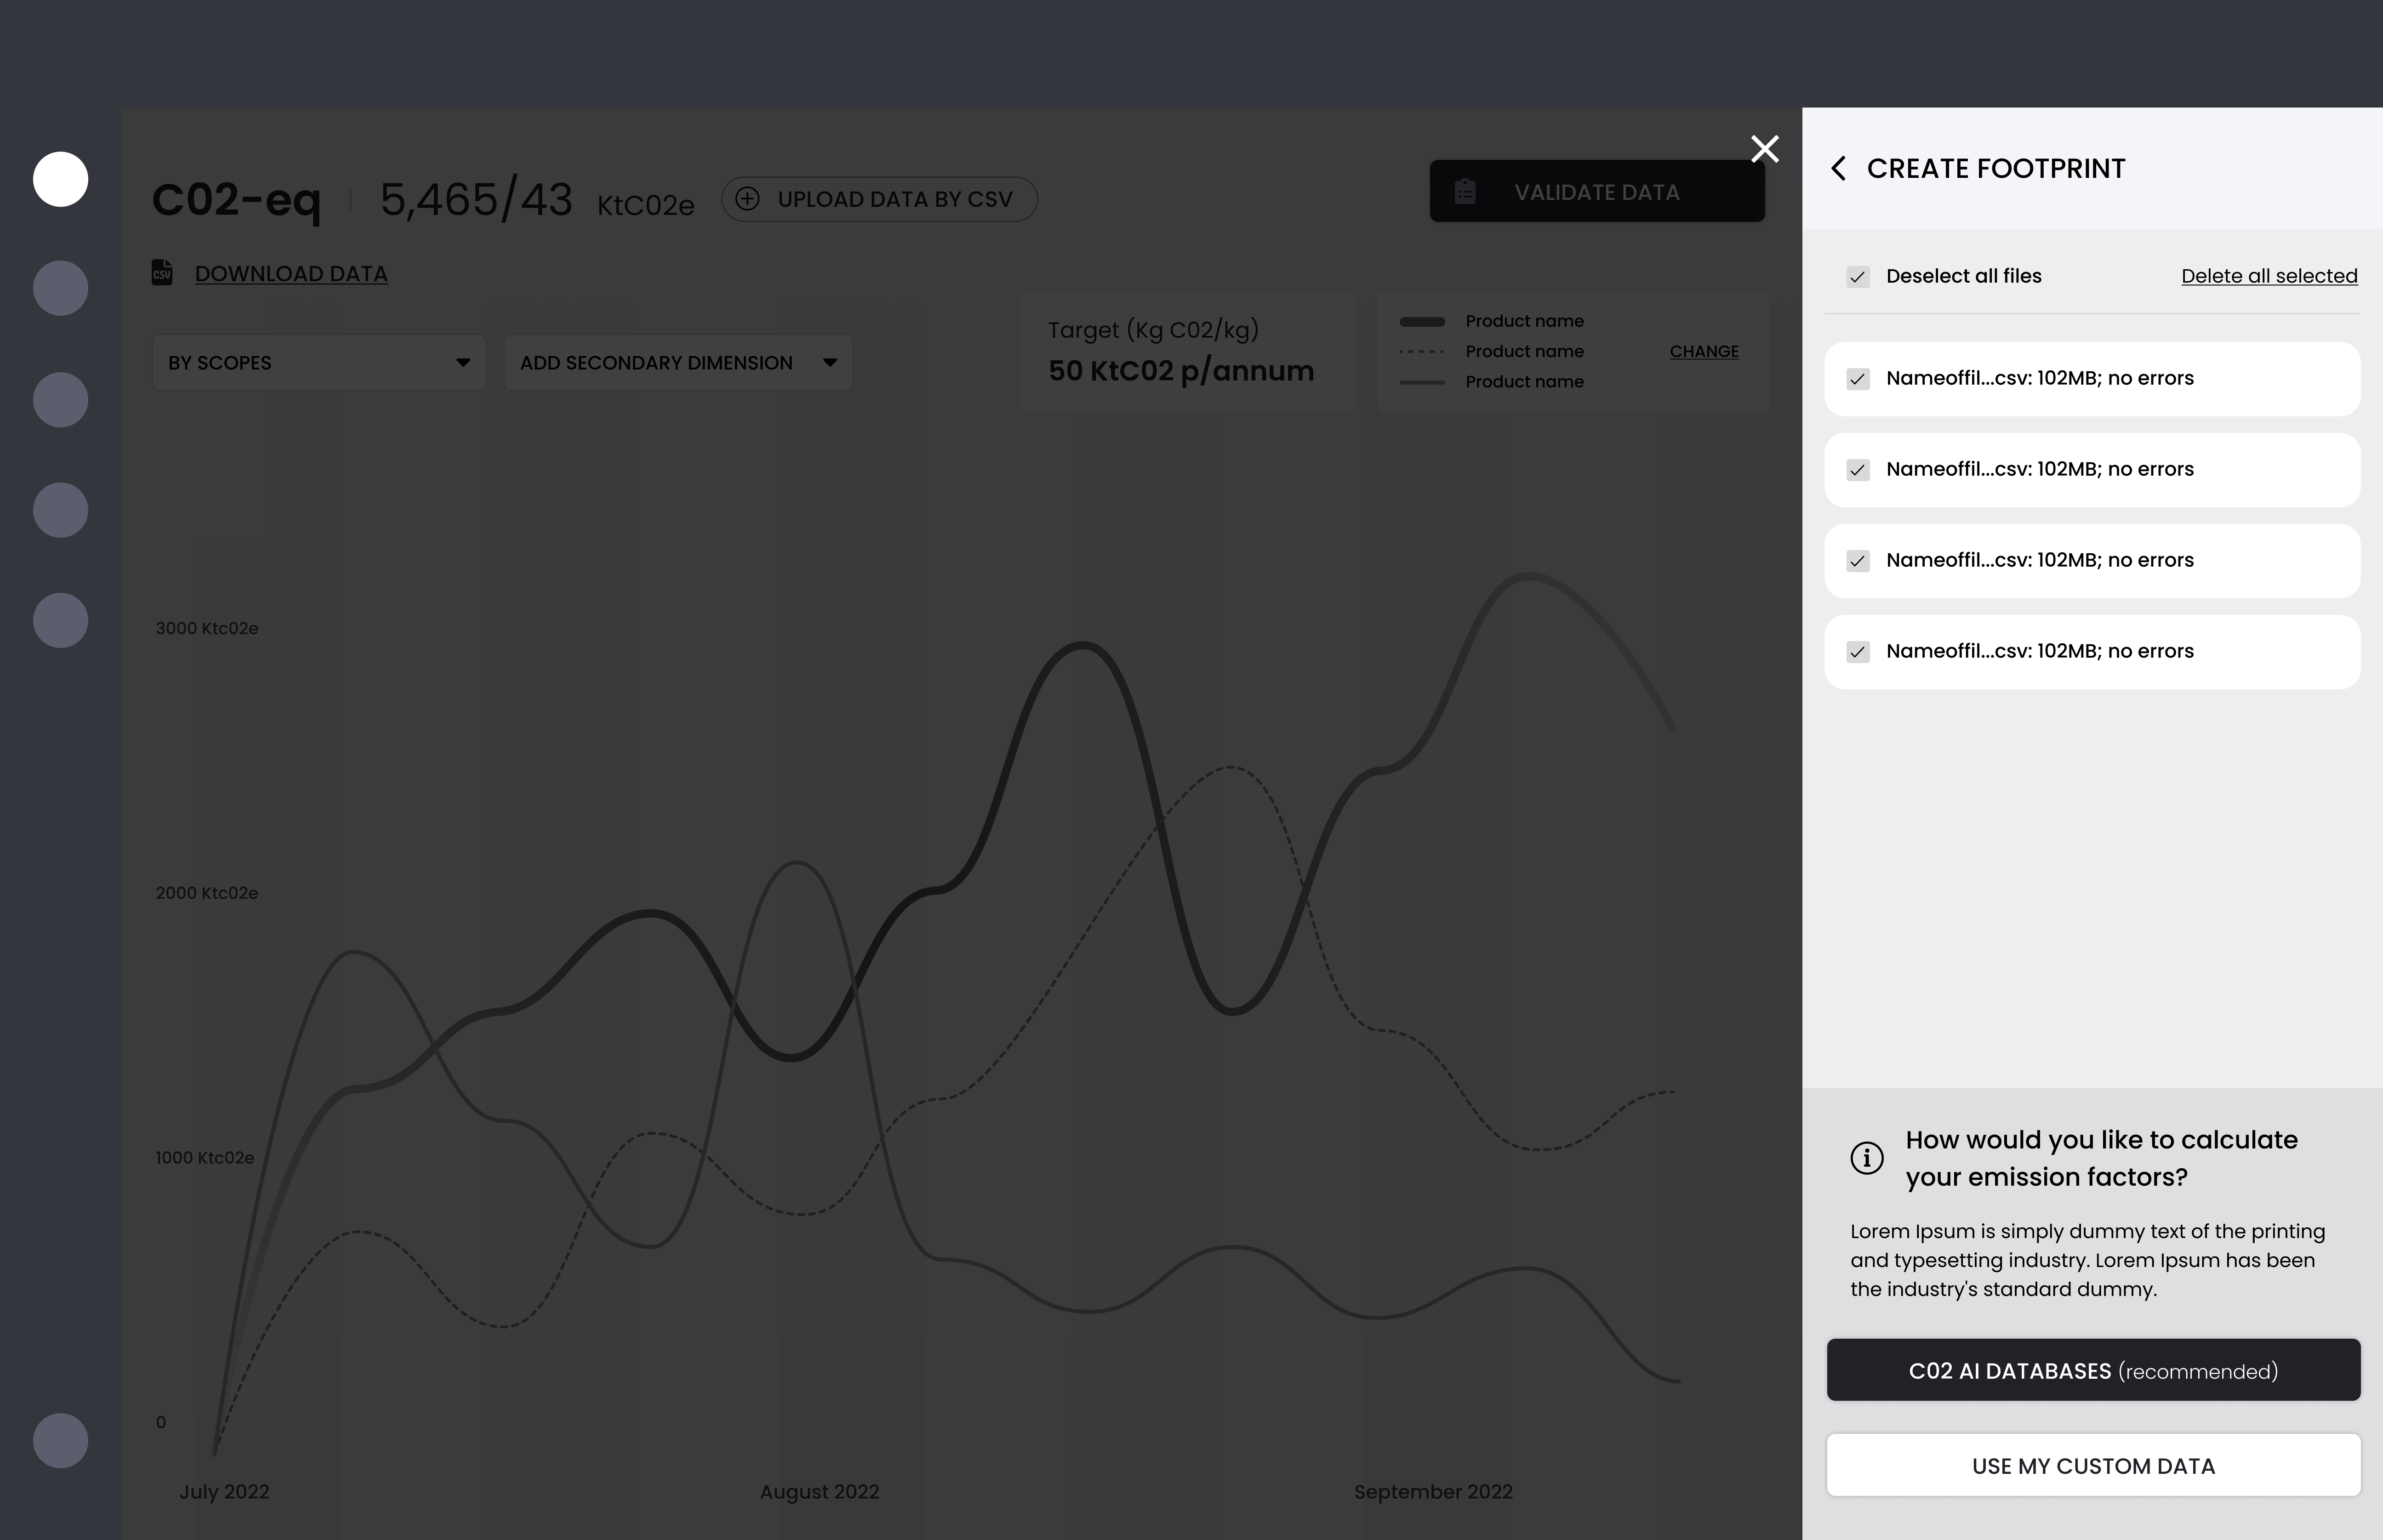
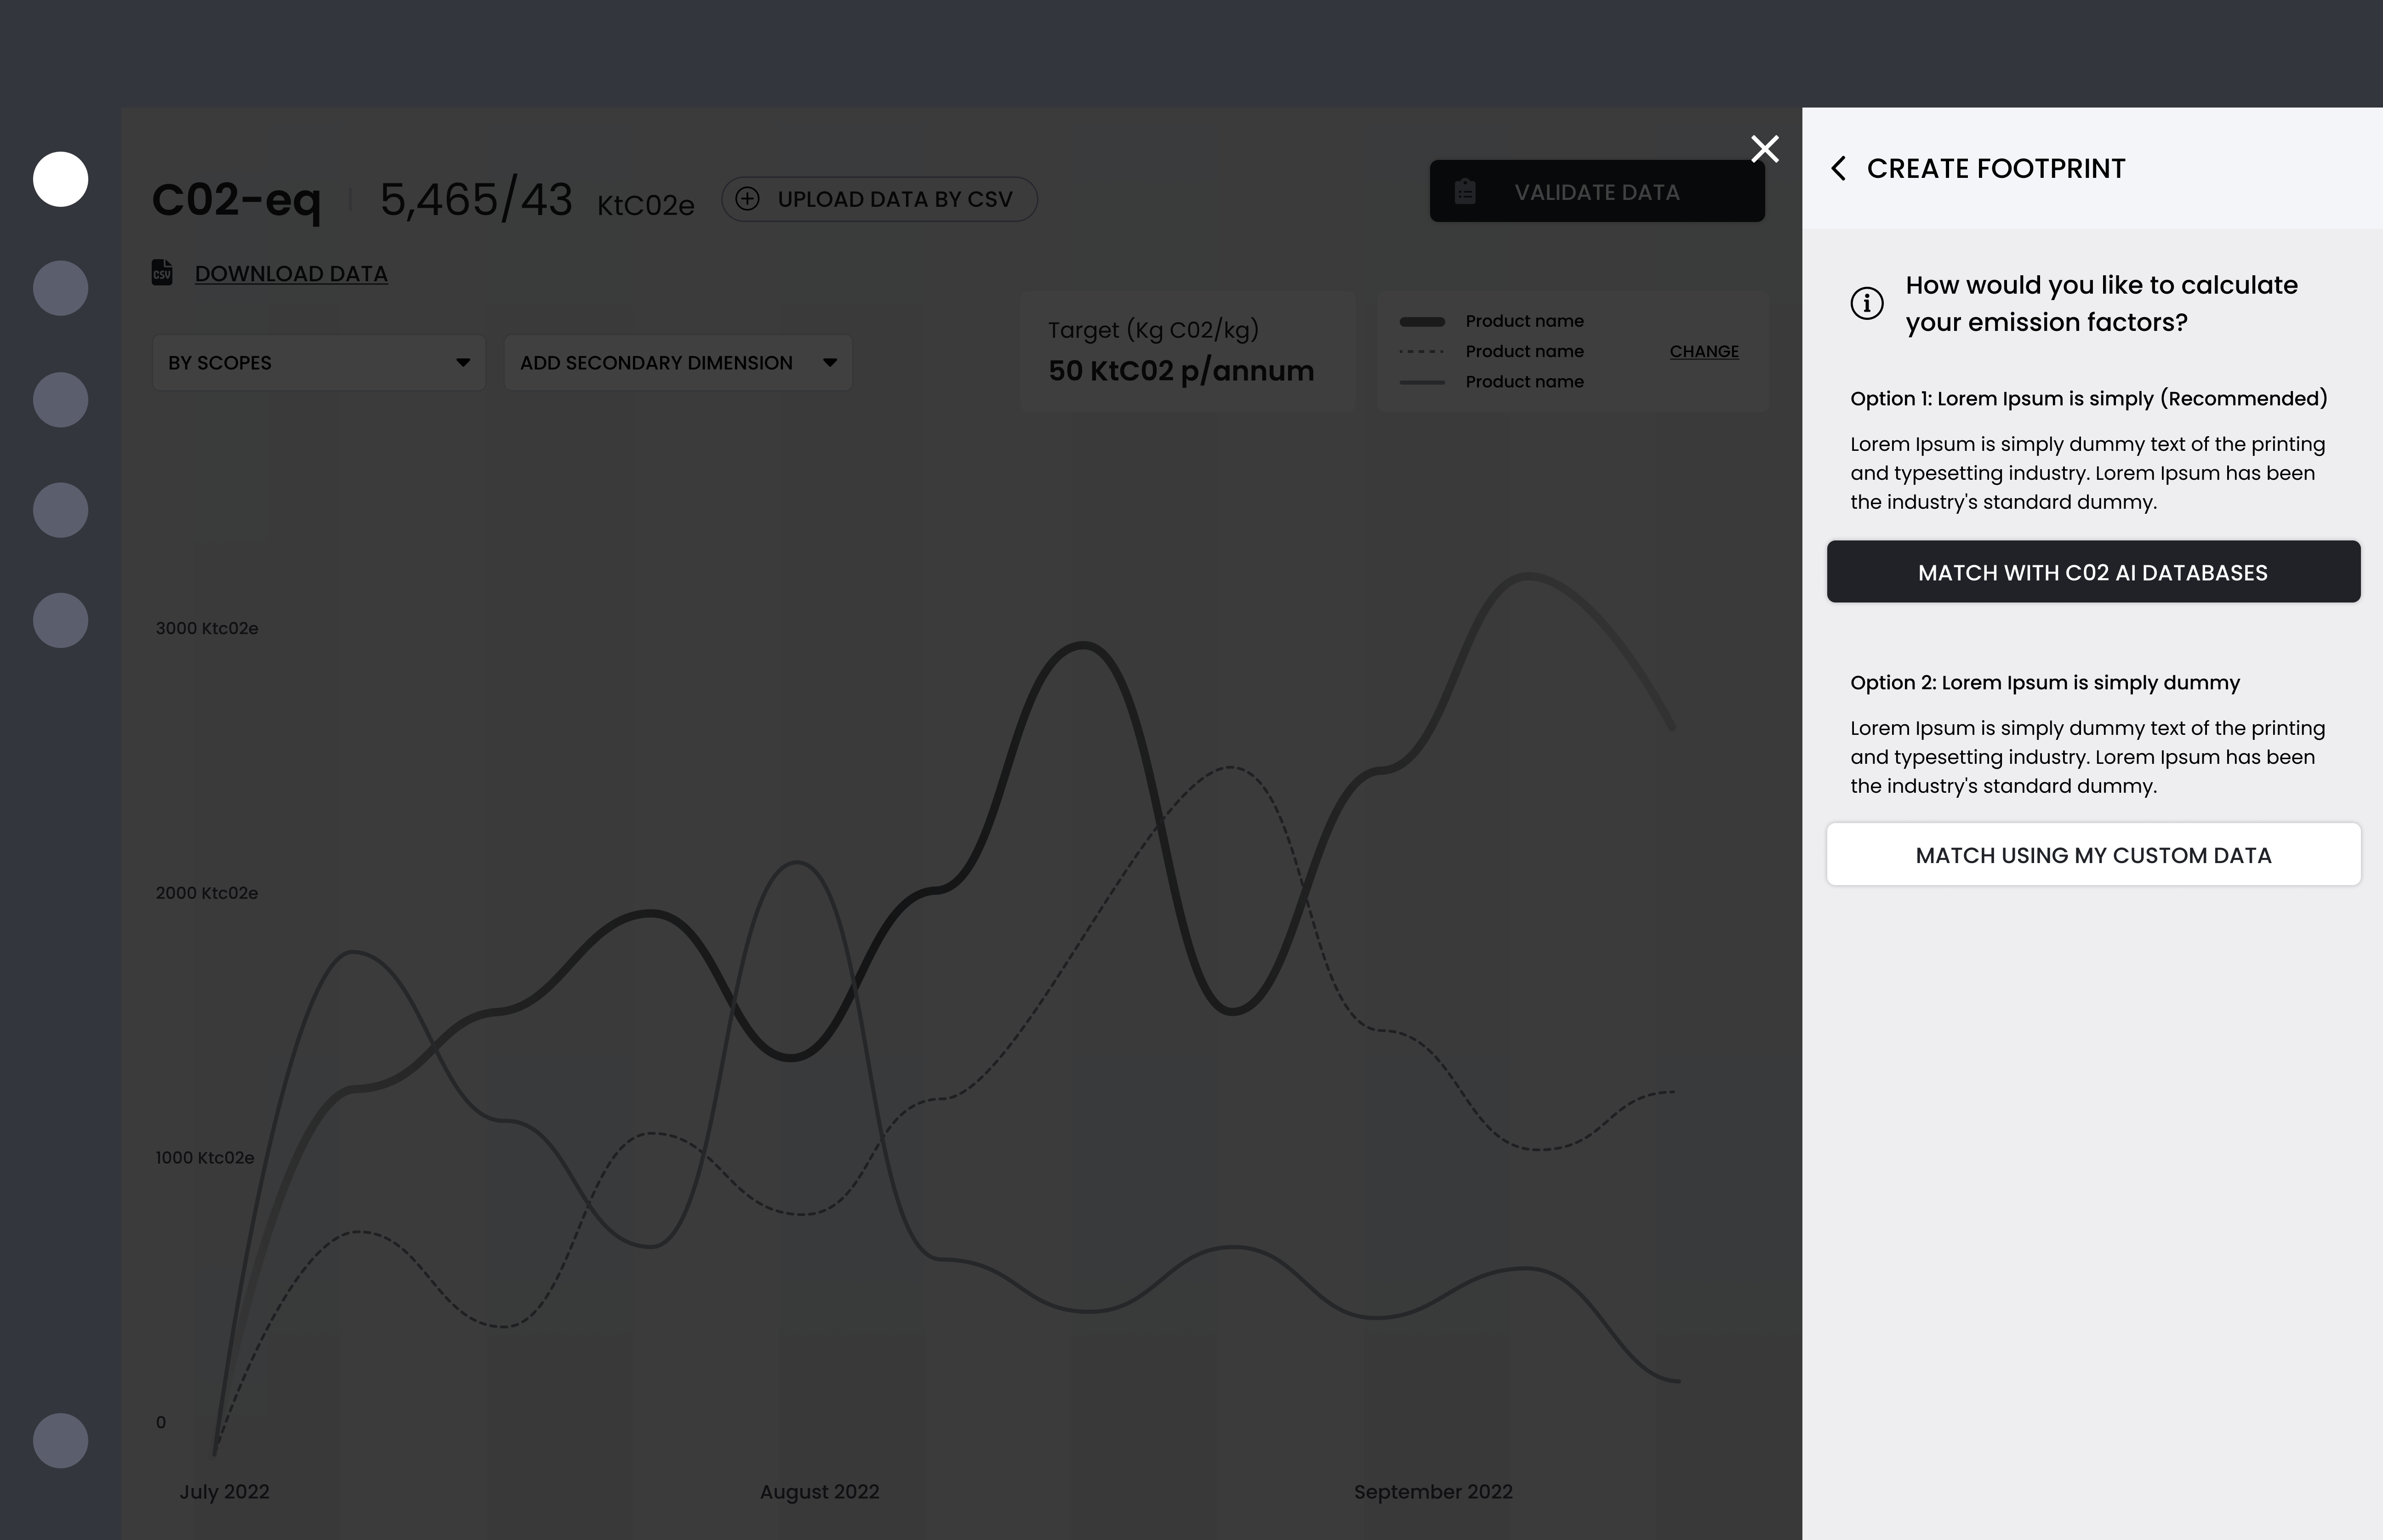
Create a Footprint
The Creator was where emissions data entered the system—but the existing process was broken. Users had to navigate 21 steps, upload one file at a time, and constantly backtrack to fix errors. For teams managing carbon data as a secondary responsibility, this was unsustainable.
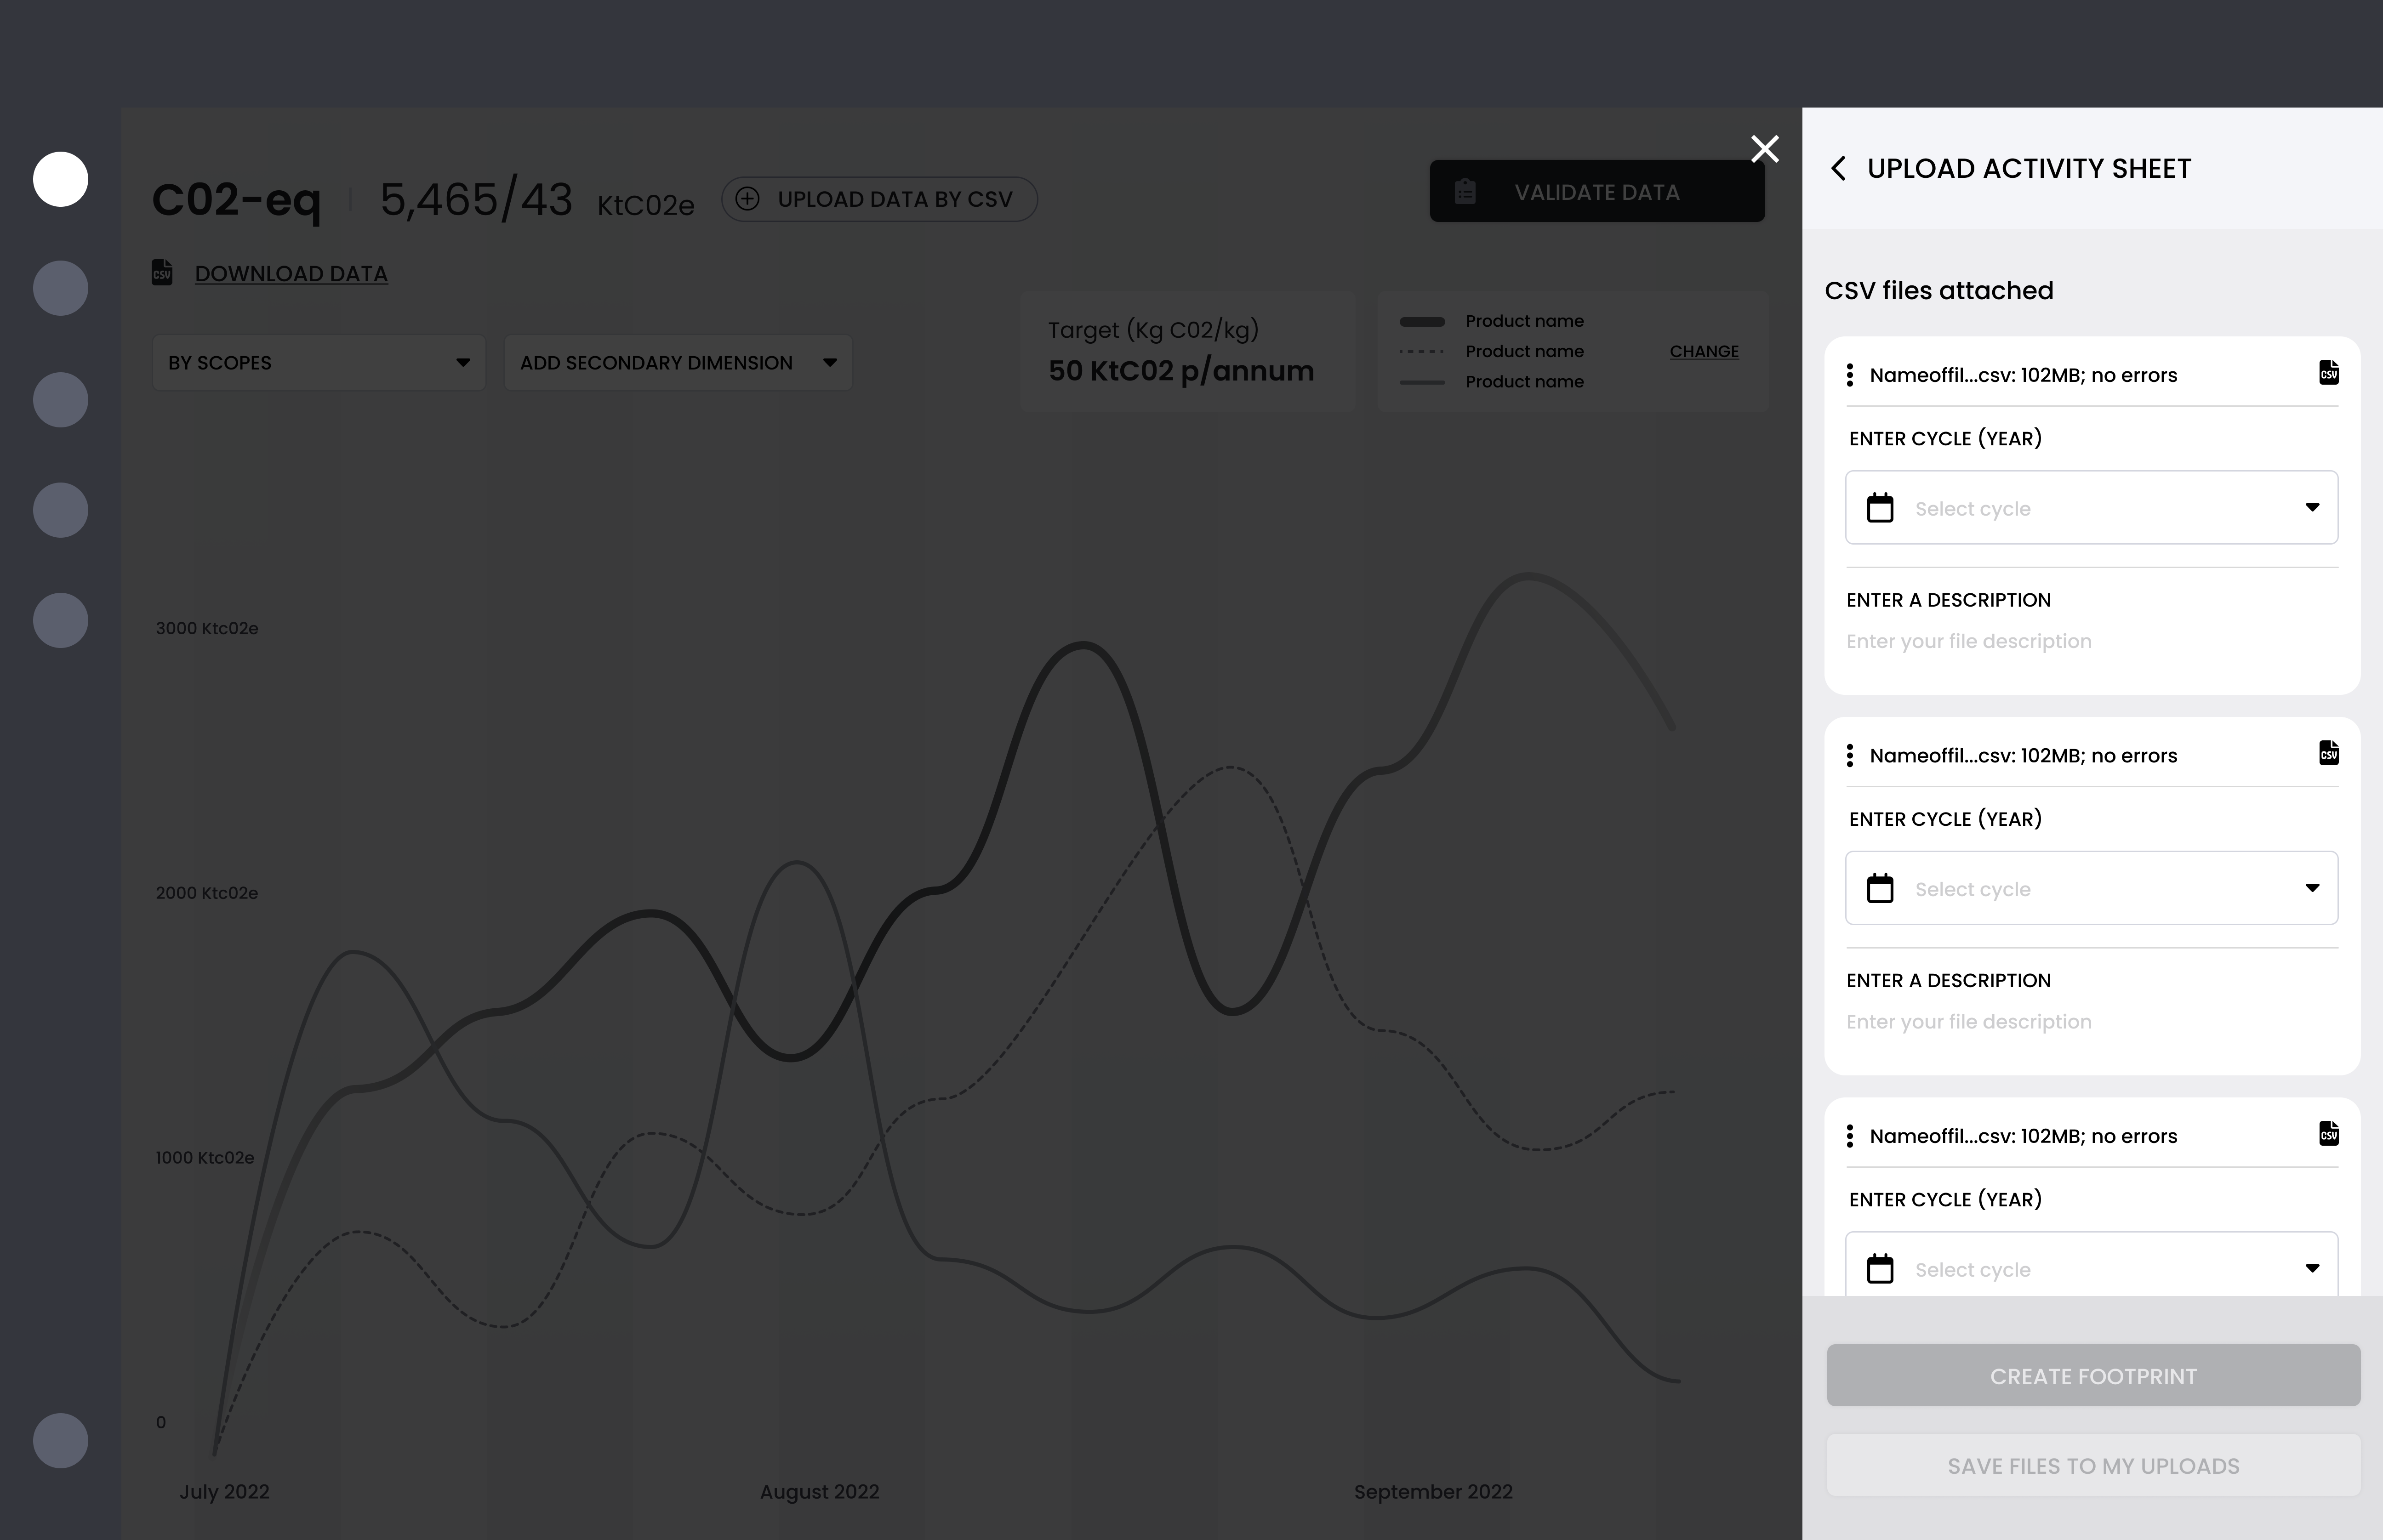
We streamlined the entire workflow—collapsing redundant steps, introducing multi-file uploads, and building overlay trays to show progress through the process. The goal was to get data into the system faster while maintaining accuracy through human validation.
The Problem
The existing footprint creation process was frustrating and inefficient, with users struggling through a fragmented workflow that offered no visibility into their progress.
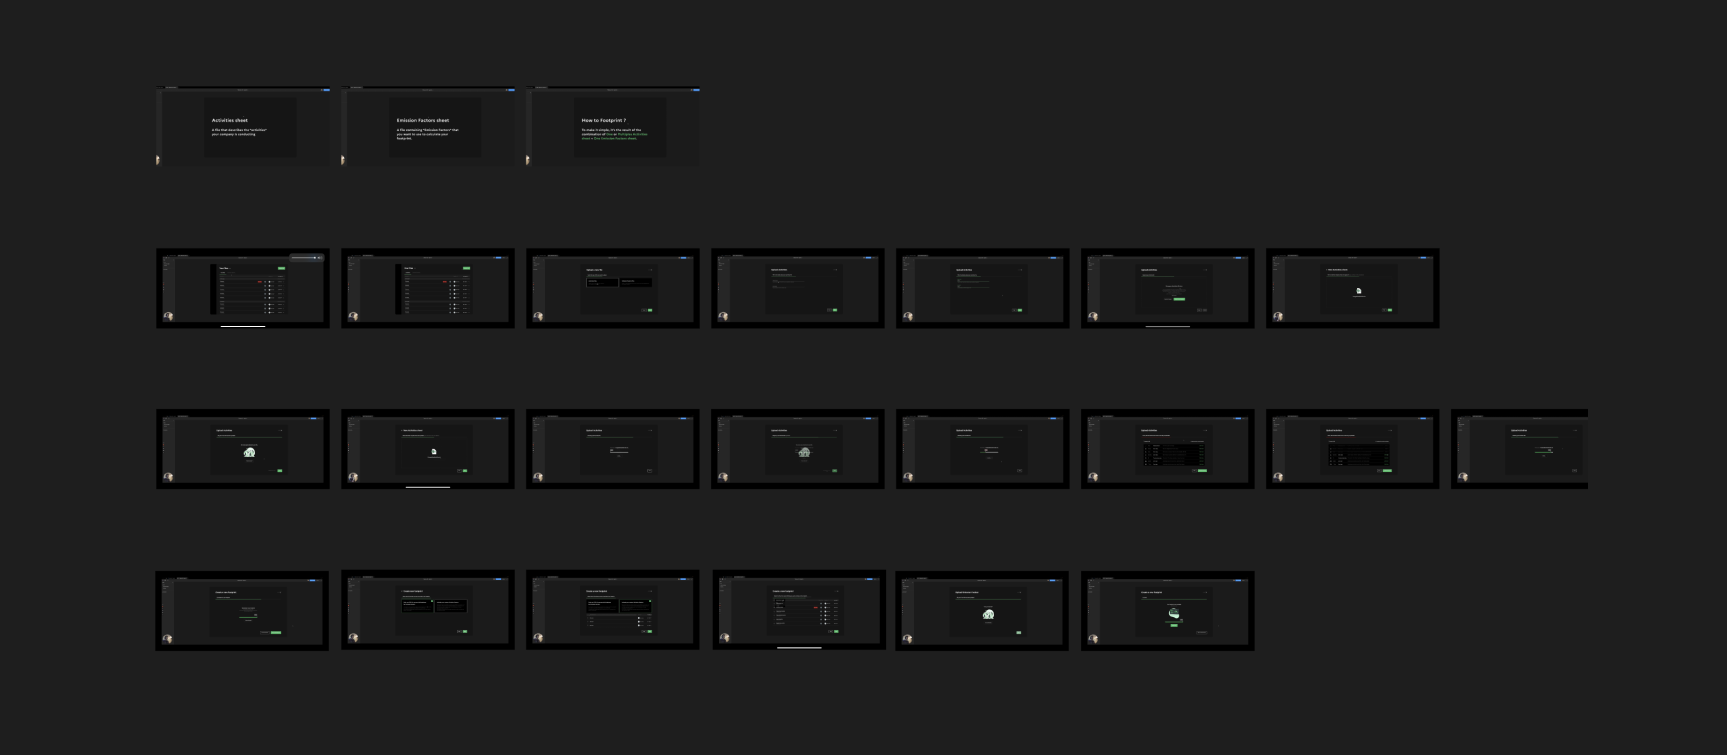
The image is intentionally blurred for confidentiality, but serves to illustrate the sheer number of screens involved in submitting a single footprint.
The Fix
I redesigned the workflow to consolidate steps, add progress visibility, and enable batch uploads — reducing friction at every stage.
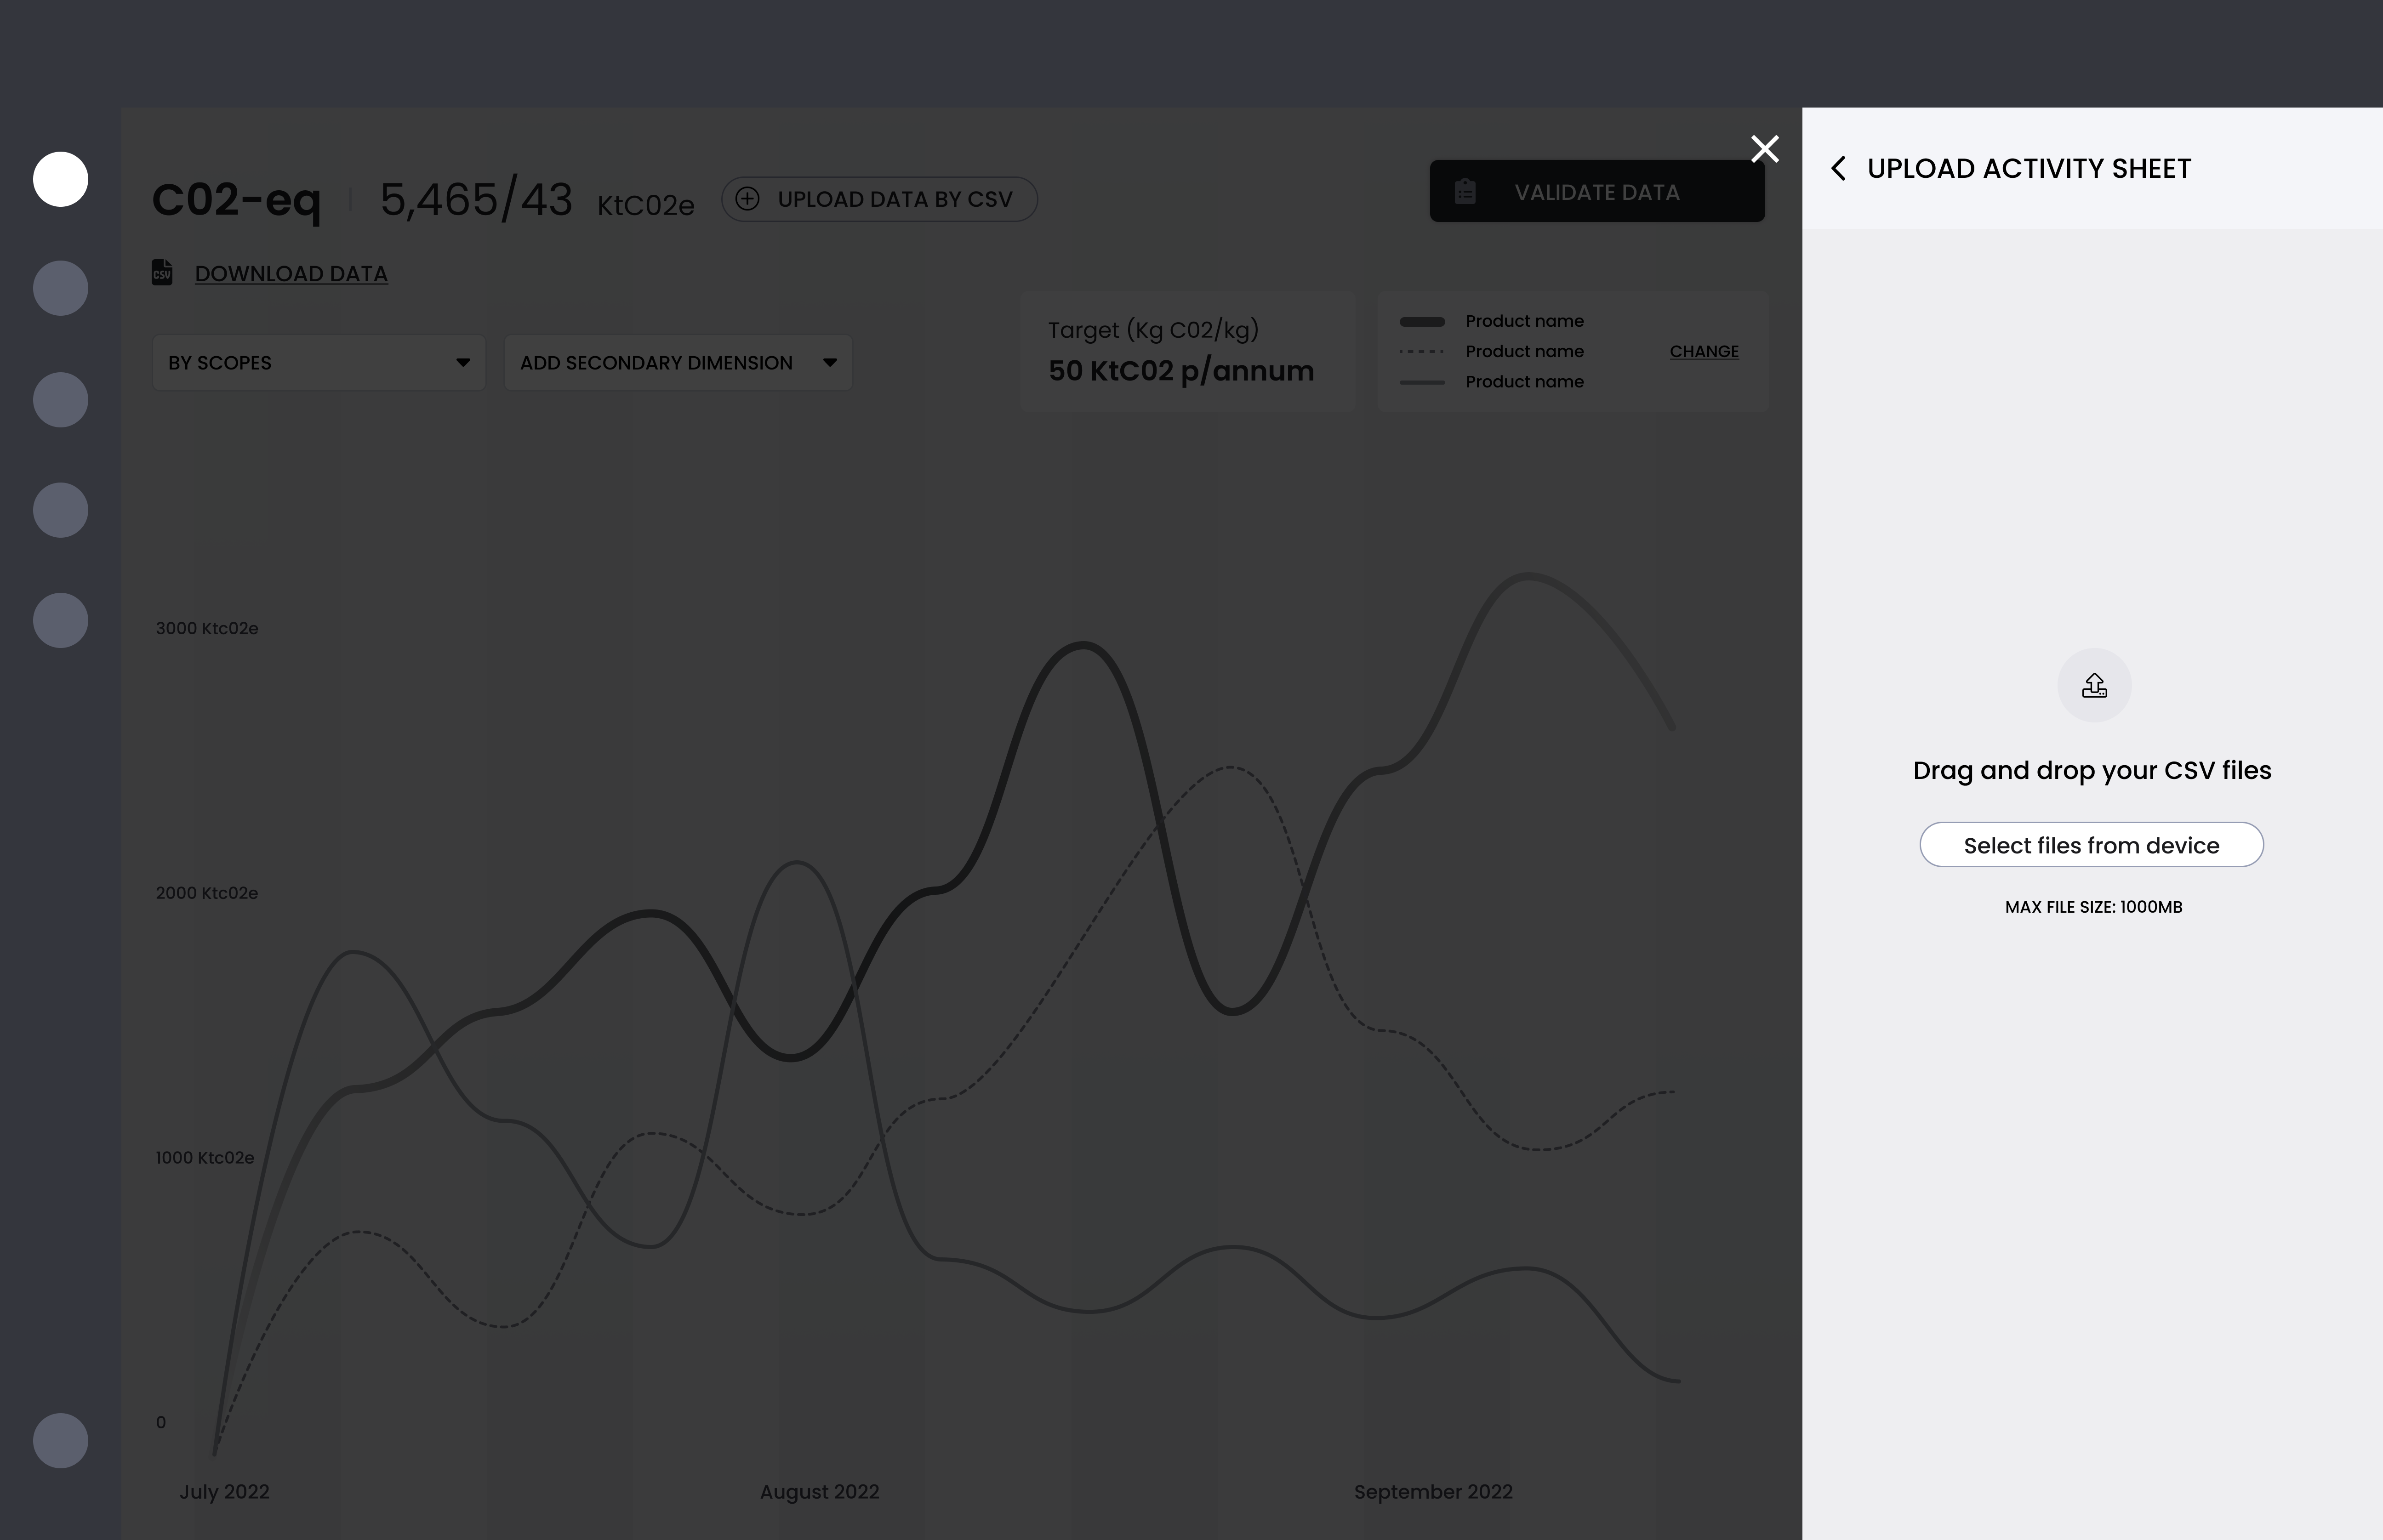
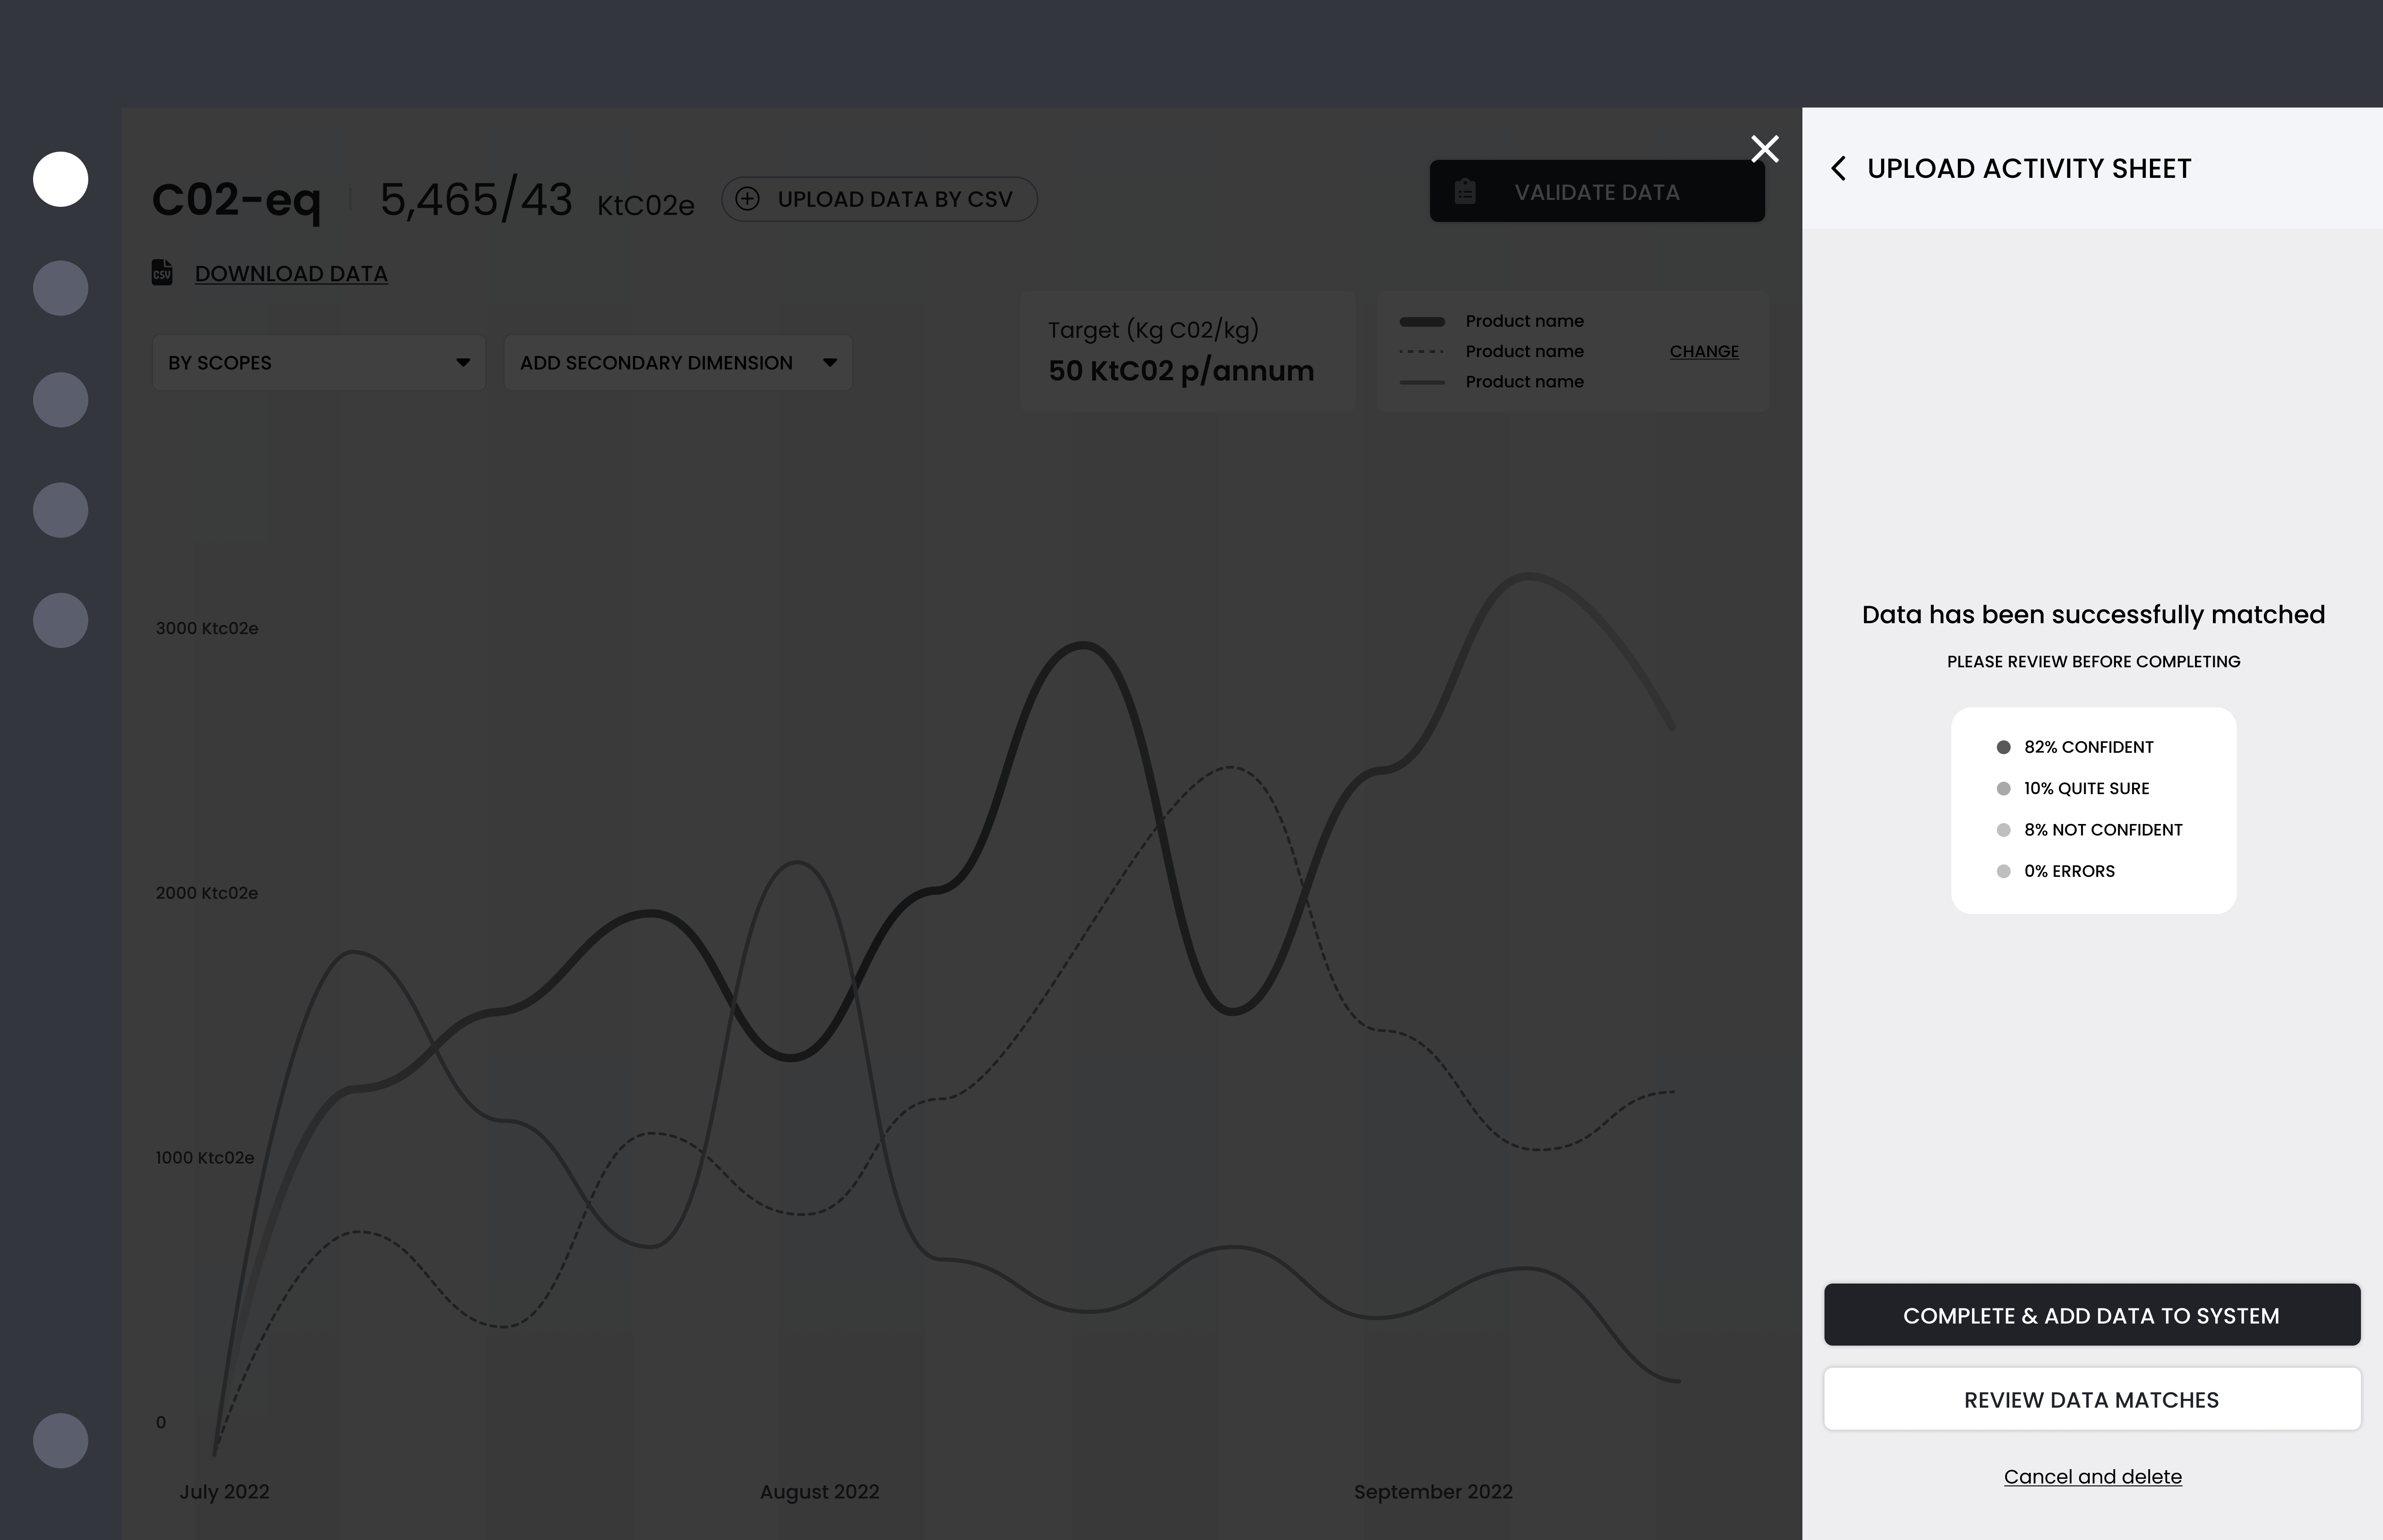
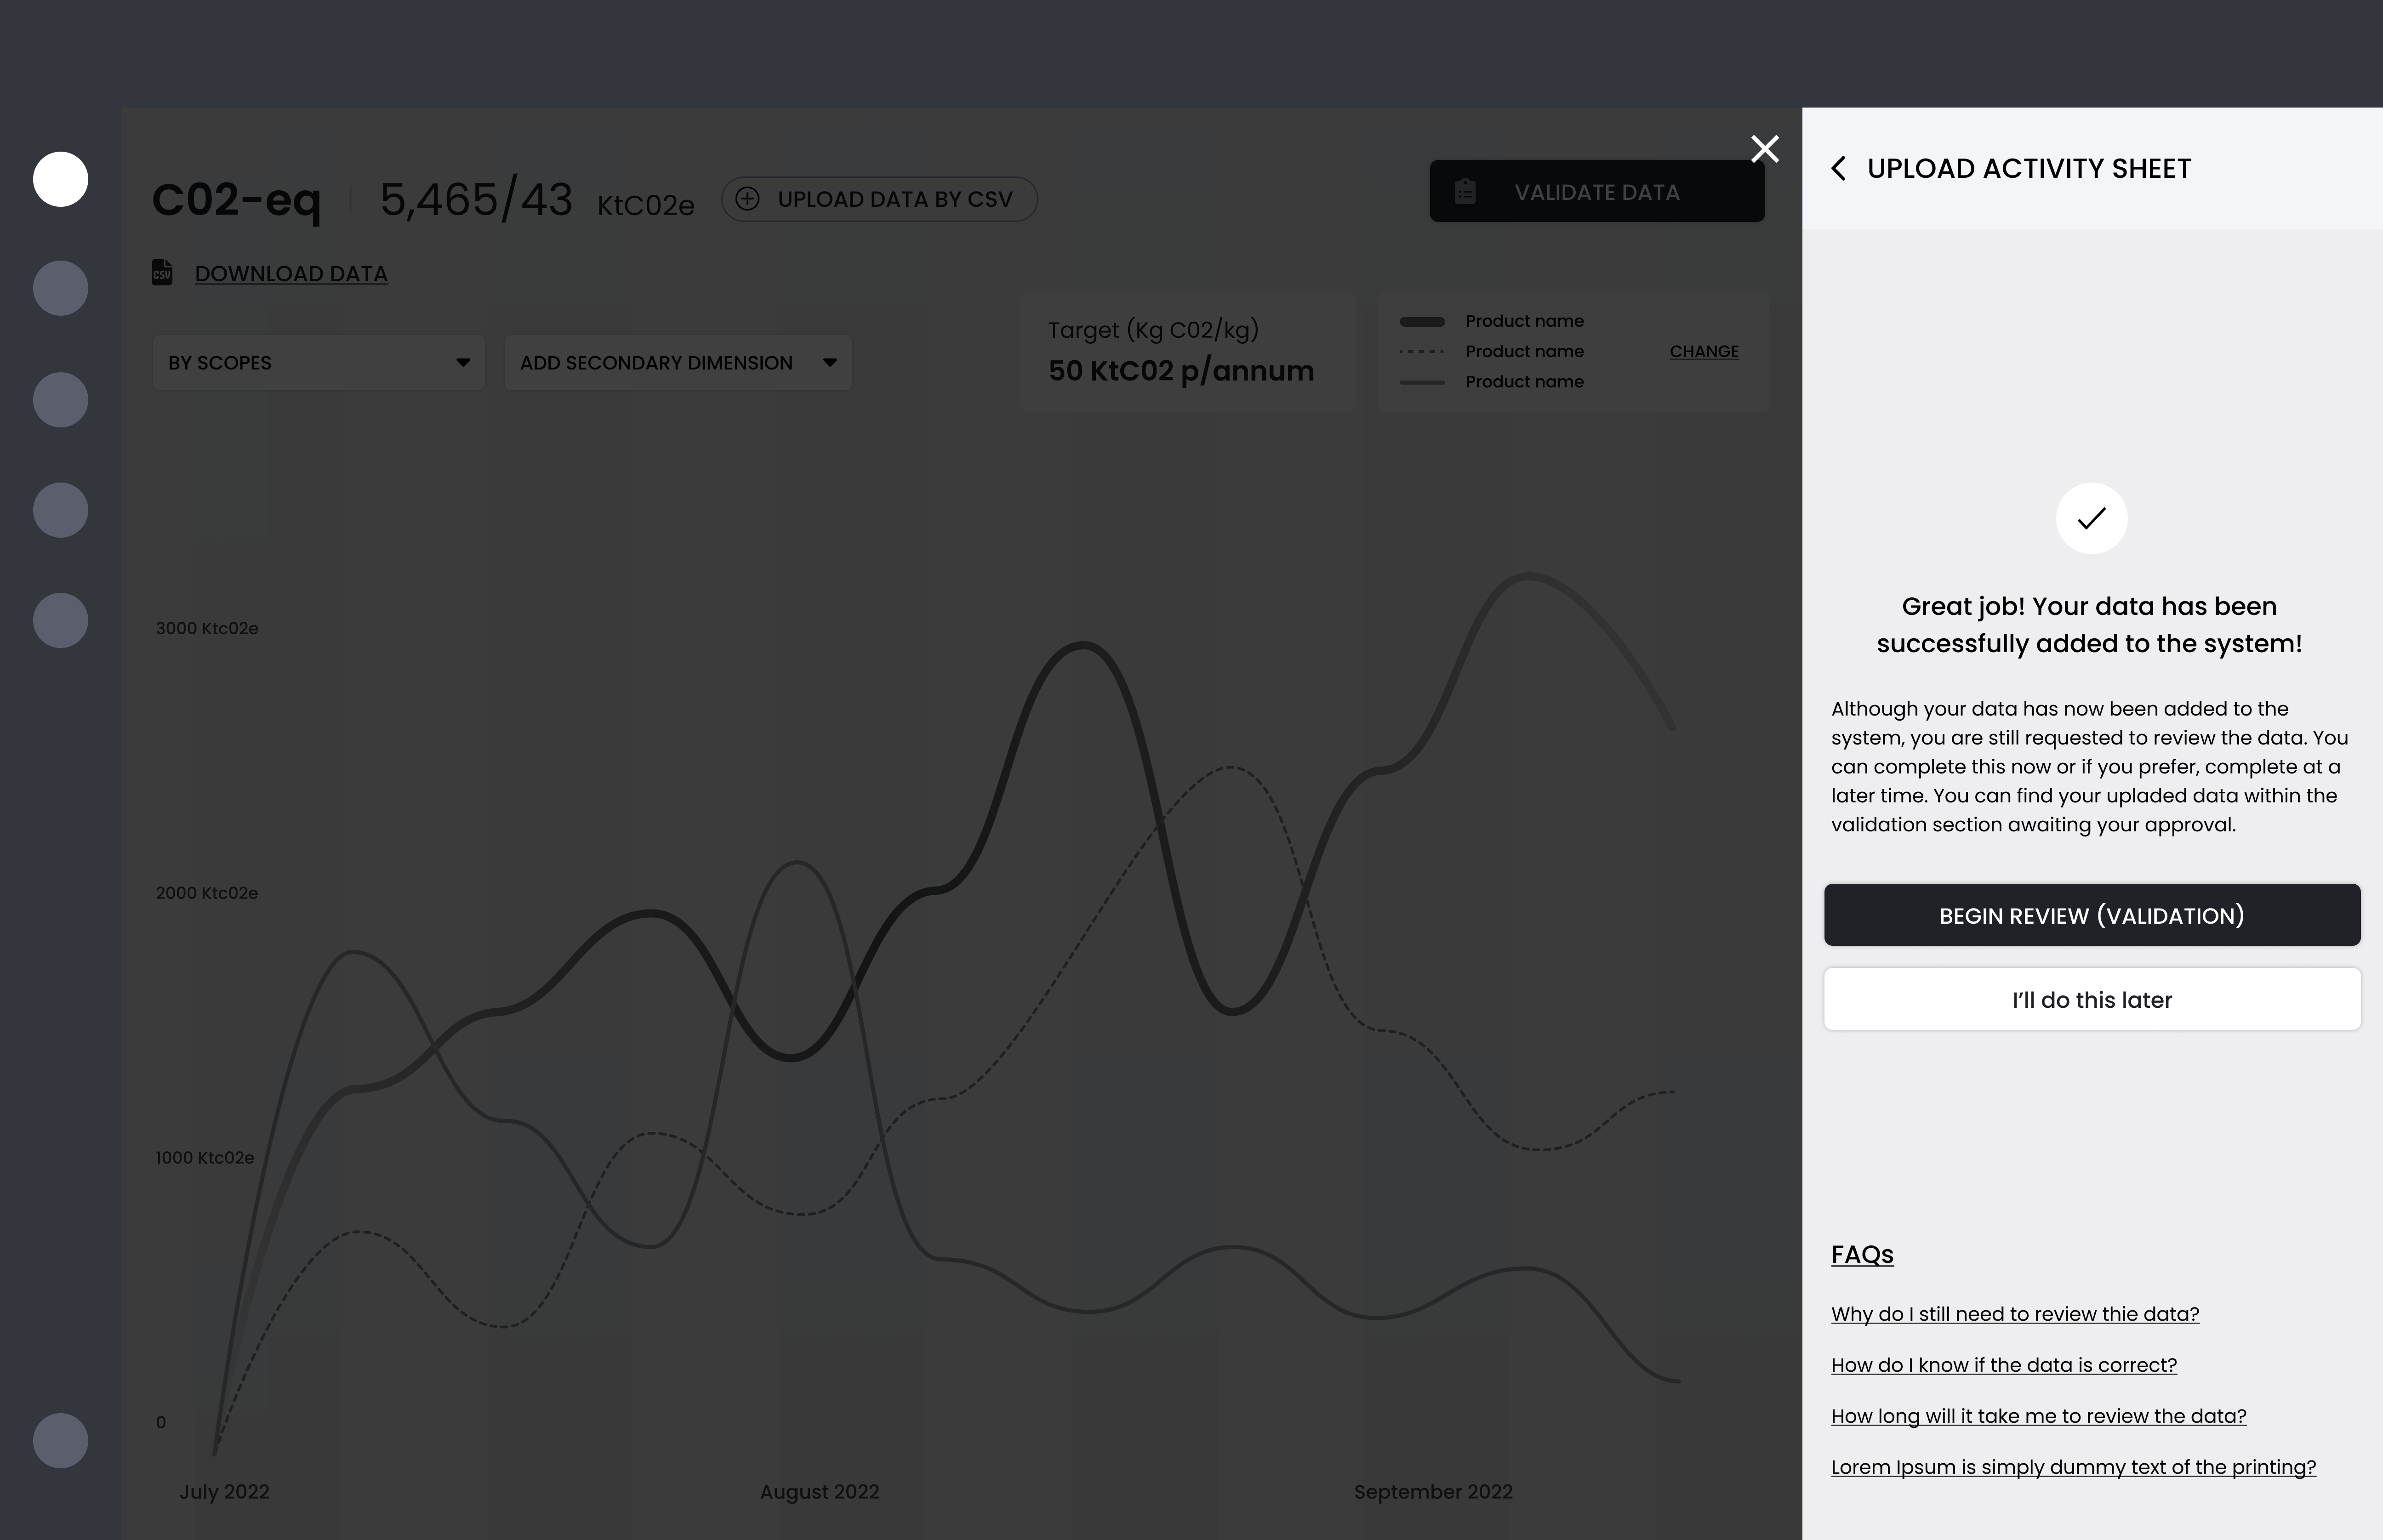
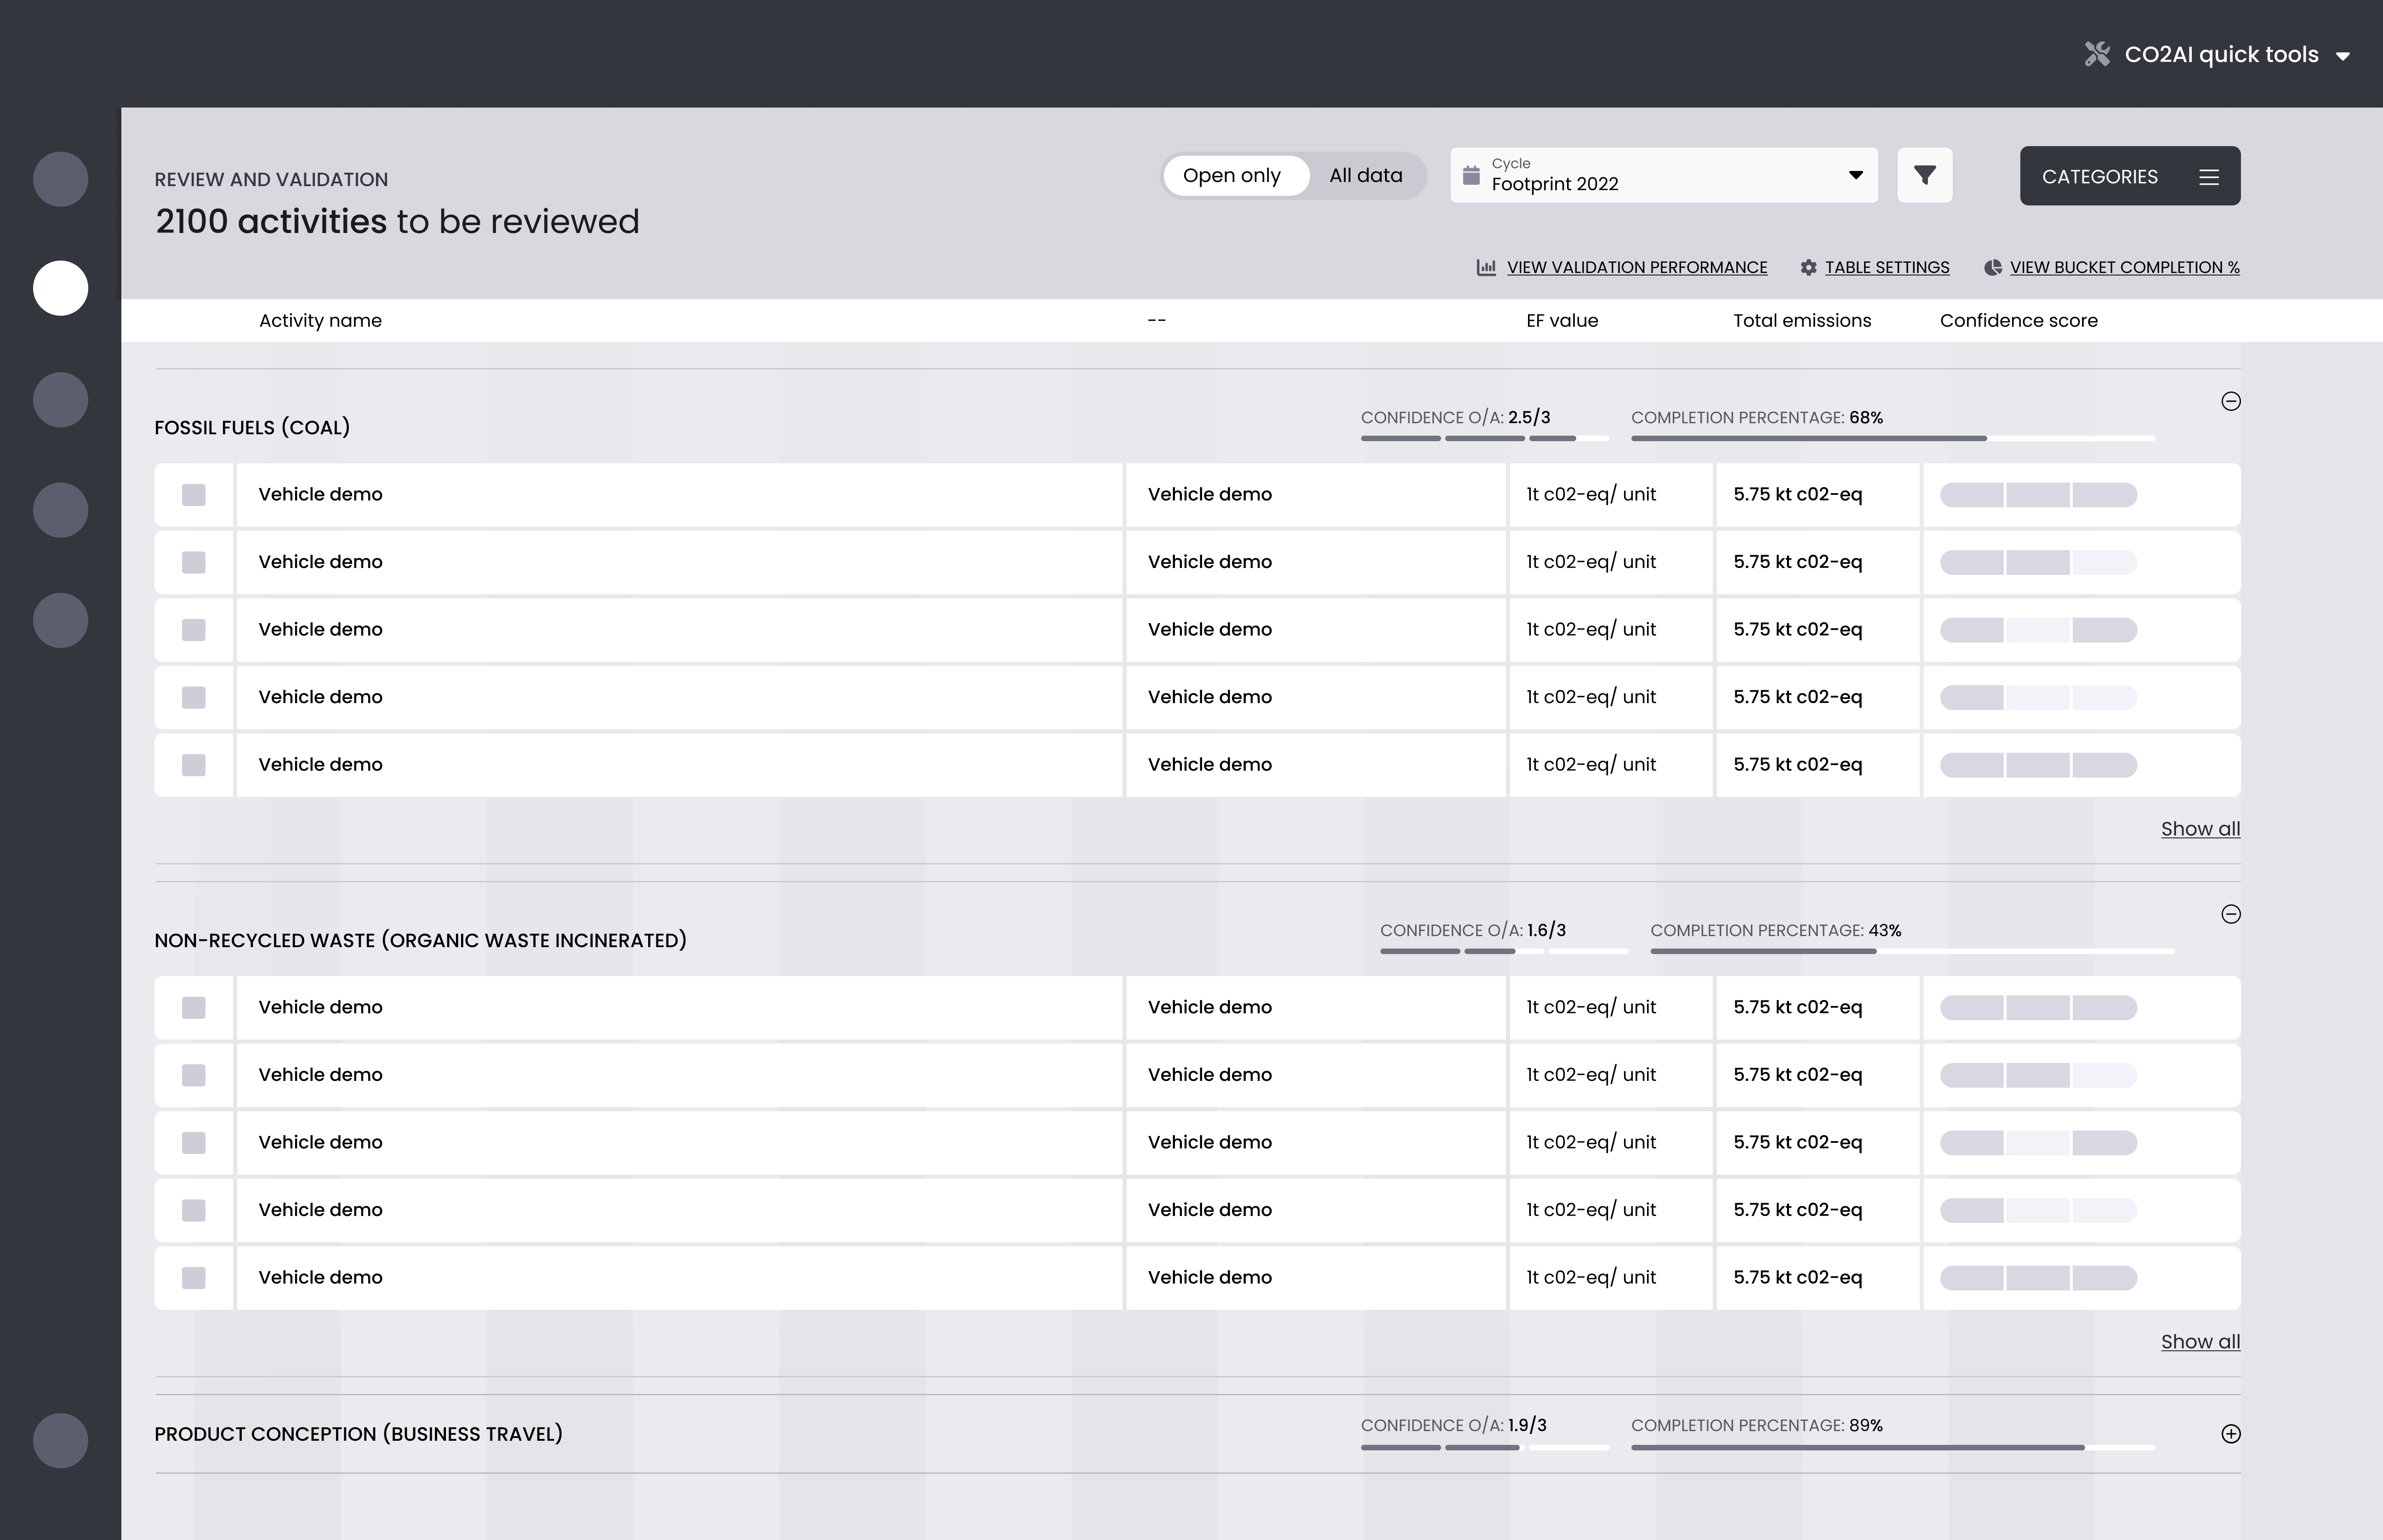
The Flow
The redesigned flow guides users through upload, data matching, and validation with clear progress indicators and streamlined interactions.
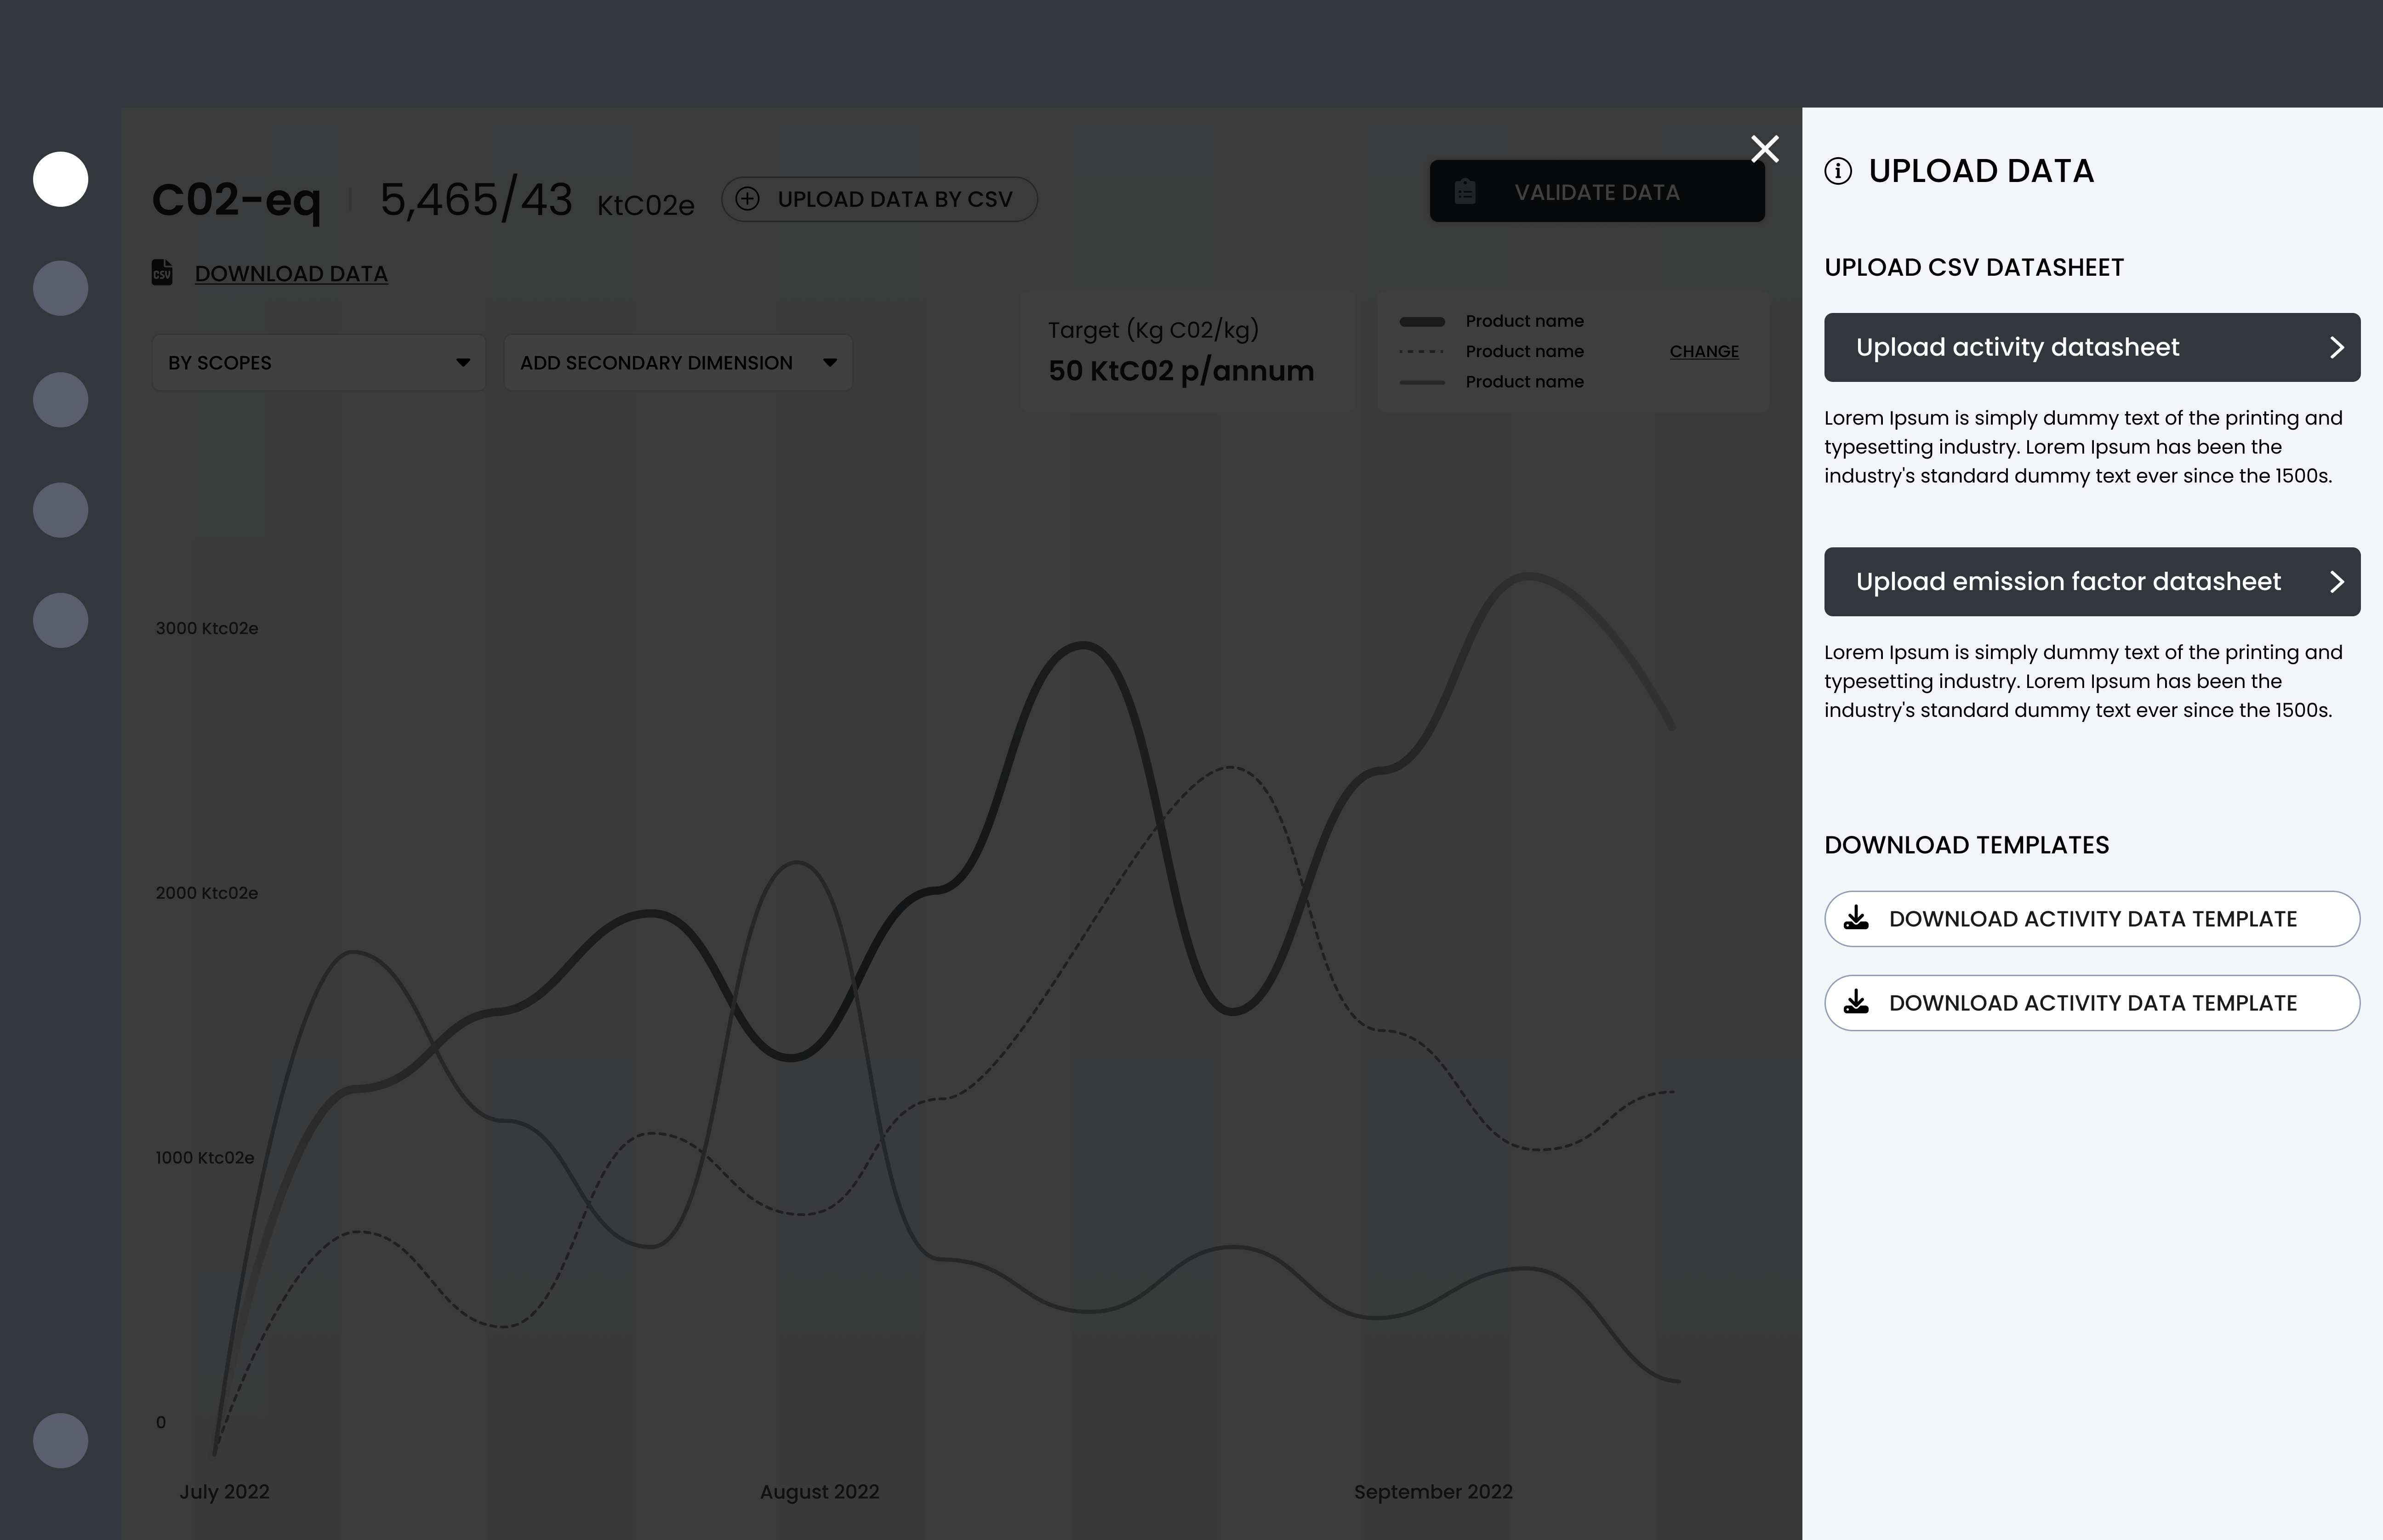

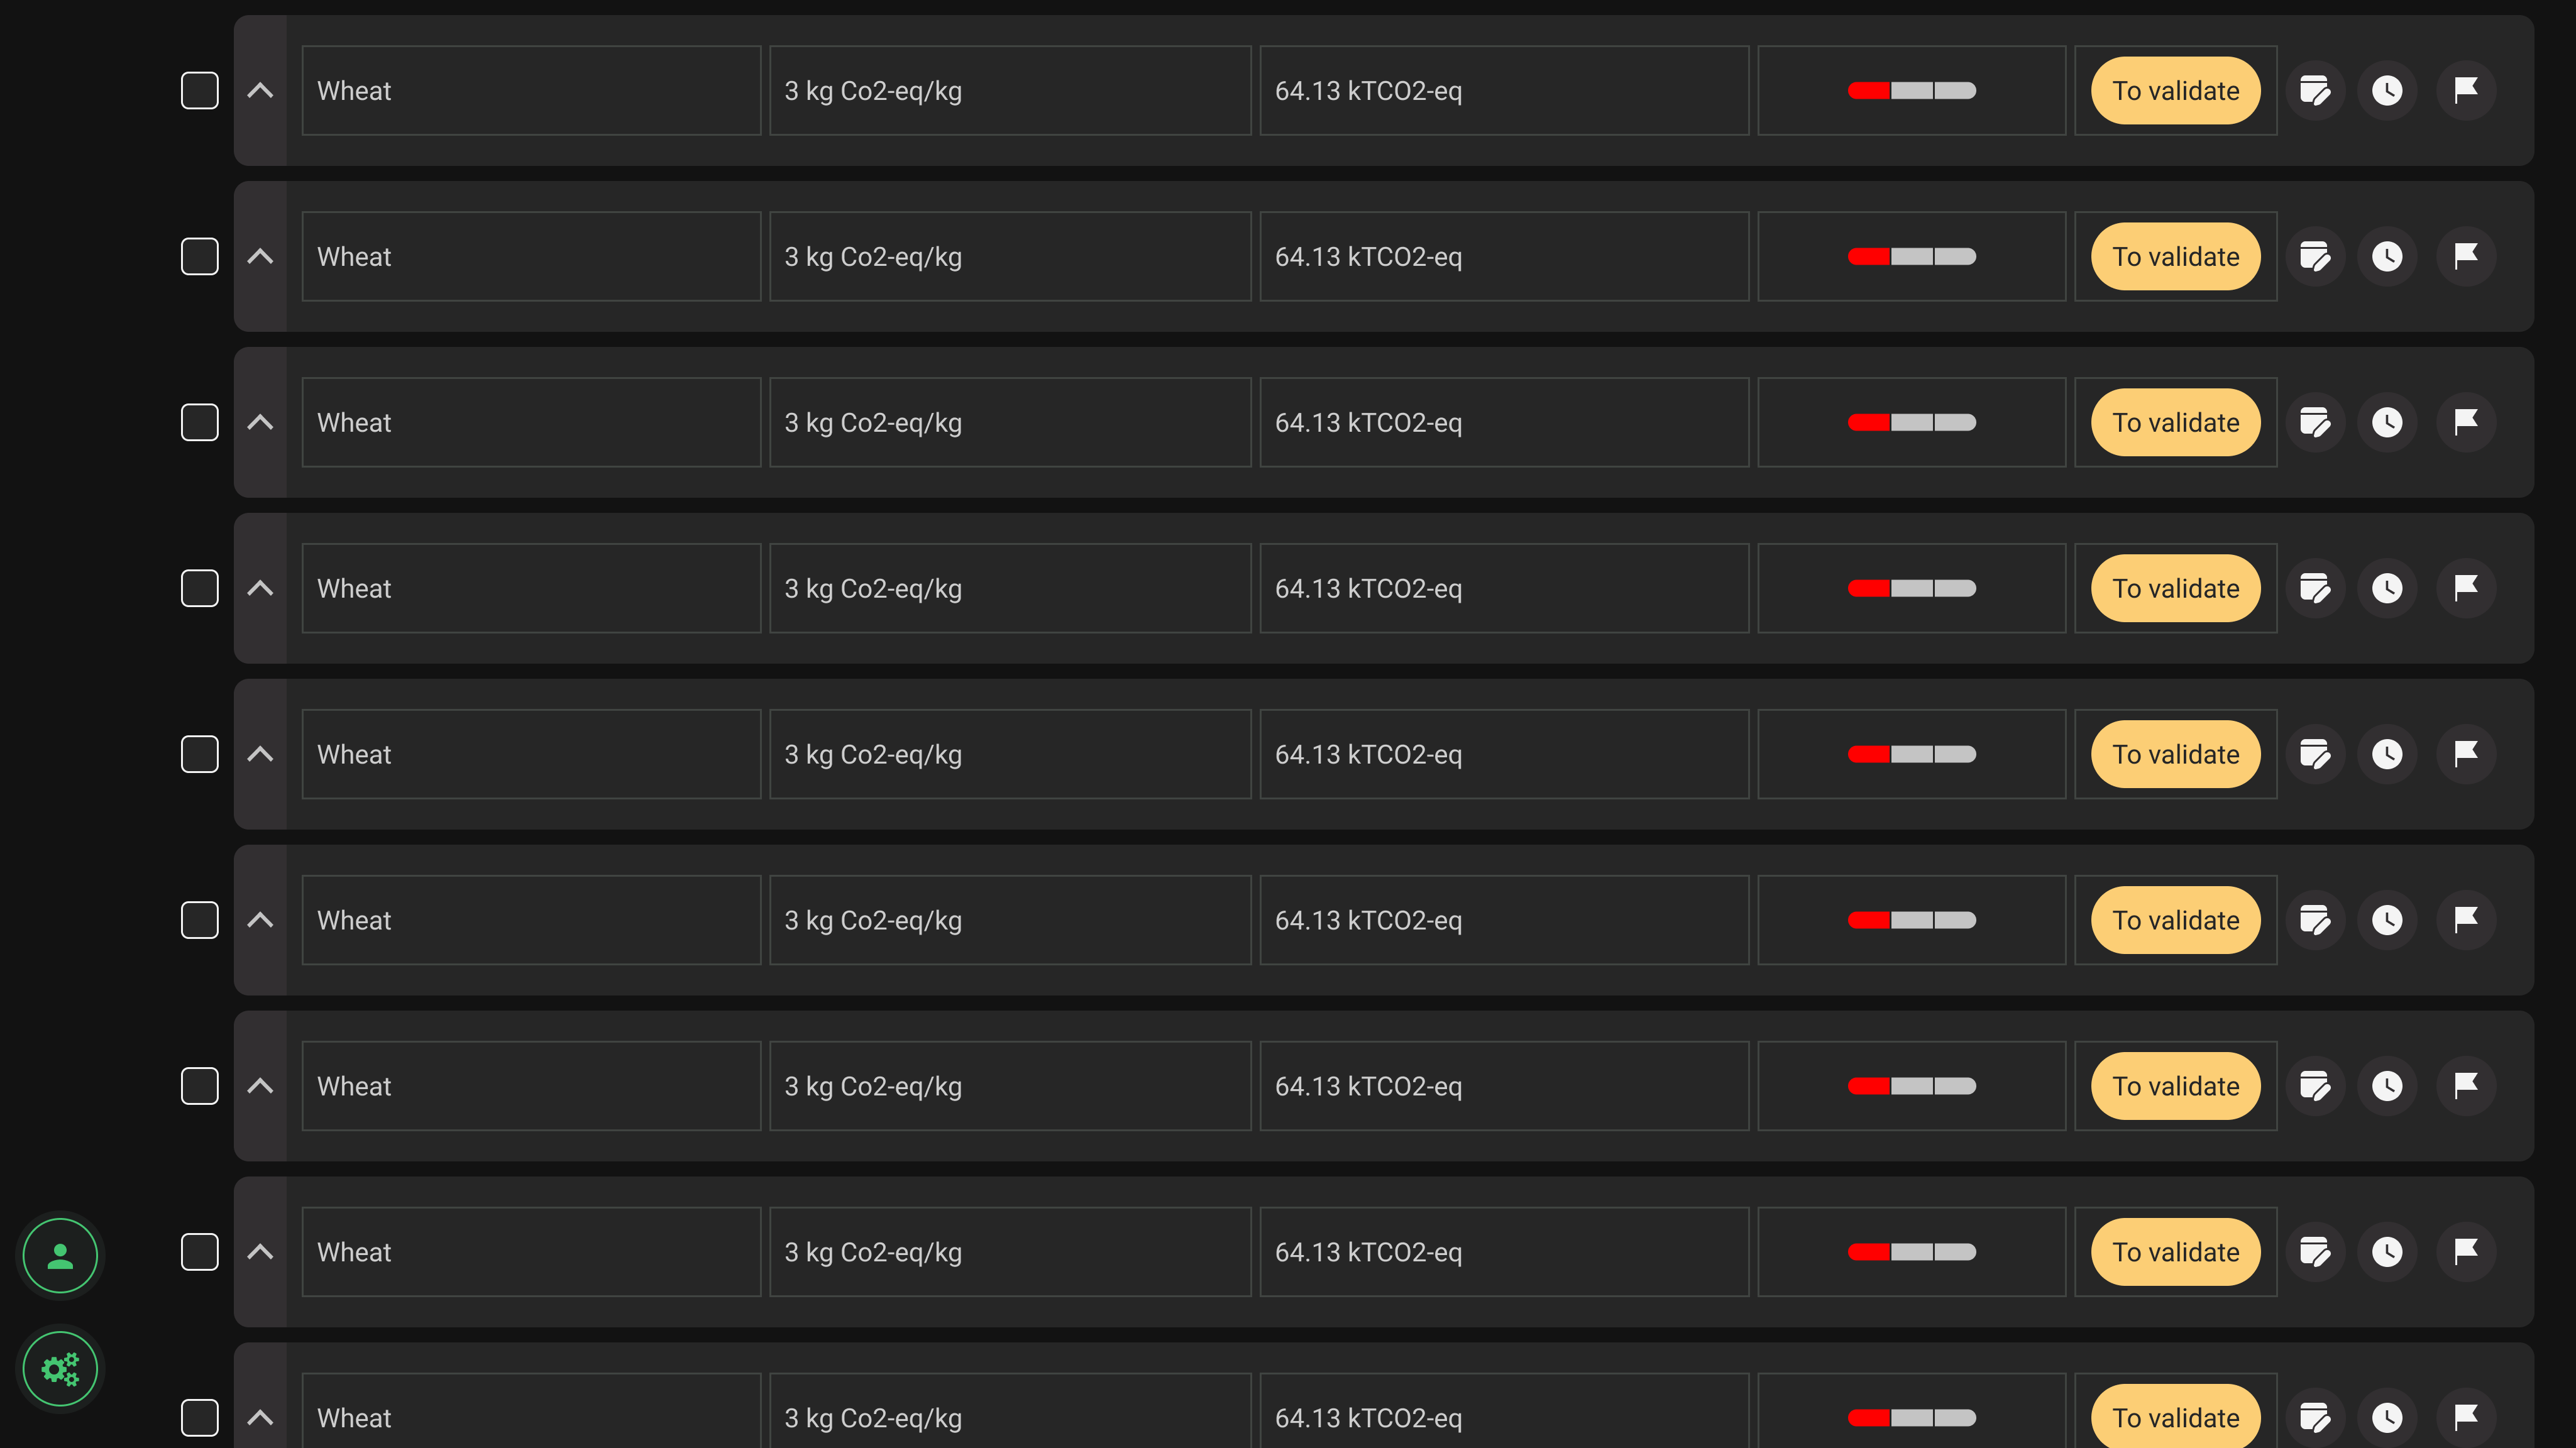
Upload Activity Data
Users begin by selecting either activity data sheets (raw emissions data) or emission factor data sheets (verified reference data). Templates are available for download to ensure consistency.
Impact
Seed Funding
CO2 AI raises 12m USD in funding
CO2 AI, a carbon tracking spinout from Boston Consulting Group, successfully raised a $12 million Seed round to build on its momentum in the rapidly growing climate tech sector.
As the Lead UX Designer, I had the privilege of contributing to this innovative project that seeks to revolutionize carbon management and sustainability.
tracxn.com/d/companies/co2-ai